

Vendor information reviewed 2 November 2026. Plan details and known add-on charges are explained in the pricing section, with a direct link to the source. Current vendor pricing.
Editorial disclosure: This is a software and pricing research draft based on the linked vendor documentation, not a claim of a completed personal product benchmark or trading outcome. We do not provide investment, financial or tax advice.
CoinGlass is best understood as a window into crypto derivatives positioning. Open interest, funding and liquidation visualizations give context that a simple price chart may not show. Each metric has specific units and exchange coverage. The platform should be evaluated for the accuracy and clarity of those definitions, not for how confidently a heatmap seems to predict price movement.
We have reviewed the published Prime offering and the distinction between visual subscriptions and separately licensed API data. We have not verified a live trading result from any liquidation cluster. A heatmap is an estimate, and an API dataset can have usage and redistribution restrictions that differ from website access. Those limitations belong beside the feature description.
📊 CoinGlass Review Summary
Best-fit use: Crypto Market Analytics. Pricing model: paid plans and potential additional data or usage charges. Check the full pricing breakdown below.
Prime is worth considering when model-based liquidation views are part of a recurring research process. A user who only follows spot prices may not need that expenditure. A developer building a data pipeline has different requirements from a person opening the website twice a week: historical endpoints, response quotas and commercial terms become decisive.
⚡ Quick Verdict: Is CoinGlass Worth It?
The practical distinction for CoinGlass is between derivatives positioning, funding-rate series and liquidation estimates and what a user can validate from the selected plan. The decisive caveat is liquidation heatmaps are model-based visualizations, not executable order books. Compare that with Glassnode before making an annual commitment.
For derivatives positioning, CoinGlass is a more direct starting point than an on-chain metric catalogue; for holder behavior and supply trends, Glassnode answers different questions. TradingView offers broader chart studies. The practical choice depends on whether the question concerns exchange contracts, blockchain transactions or technical price history.
🧠 What Is CoinGlass?
CoinGlass is a platform in the Crypto Market Analytics software category. Its relevant published capabilities include derivatives positioning, funding-rate series and liquidation estimates; liquidation heatmaps and cross-exchange market dashboards; prime heatmap access and expanded model features; separate api offering for programmatic crypto market data. This makes it part of the broader trading-software stack, but it should not be confused with a guarantee of successful trades, a regulated investment recommendation or a substitute for evaluating market-data licensing.
A suitable CoinGlass buyer has a defined task: compare contract-normalized open interest on two venues. A person needing prime heatmap access and expanded model features may face a different licensing decision from someone who only reads weekly research. Name the instrument, expected export and budget before choosing a subscription tier. This avoids comparing products with different purposes as though their feature lists were directly interchangeable.
🖥️ Interface, Data and Day-to-Day Workflow
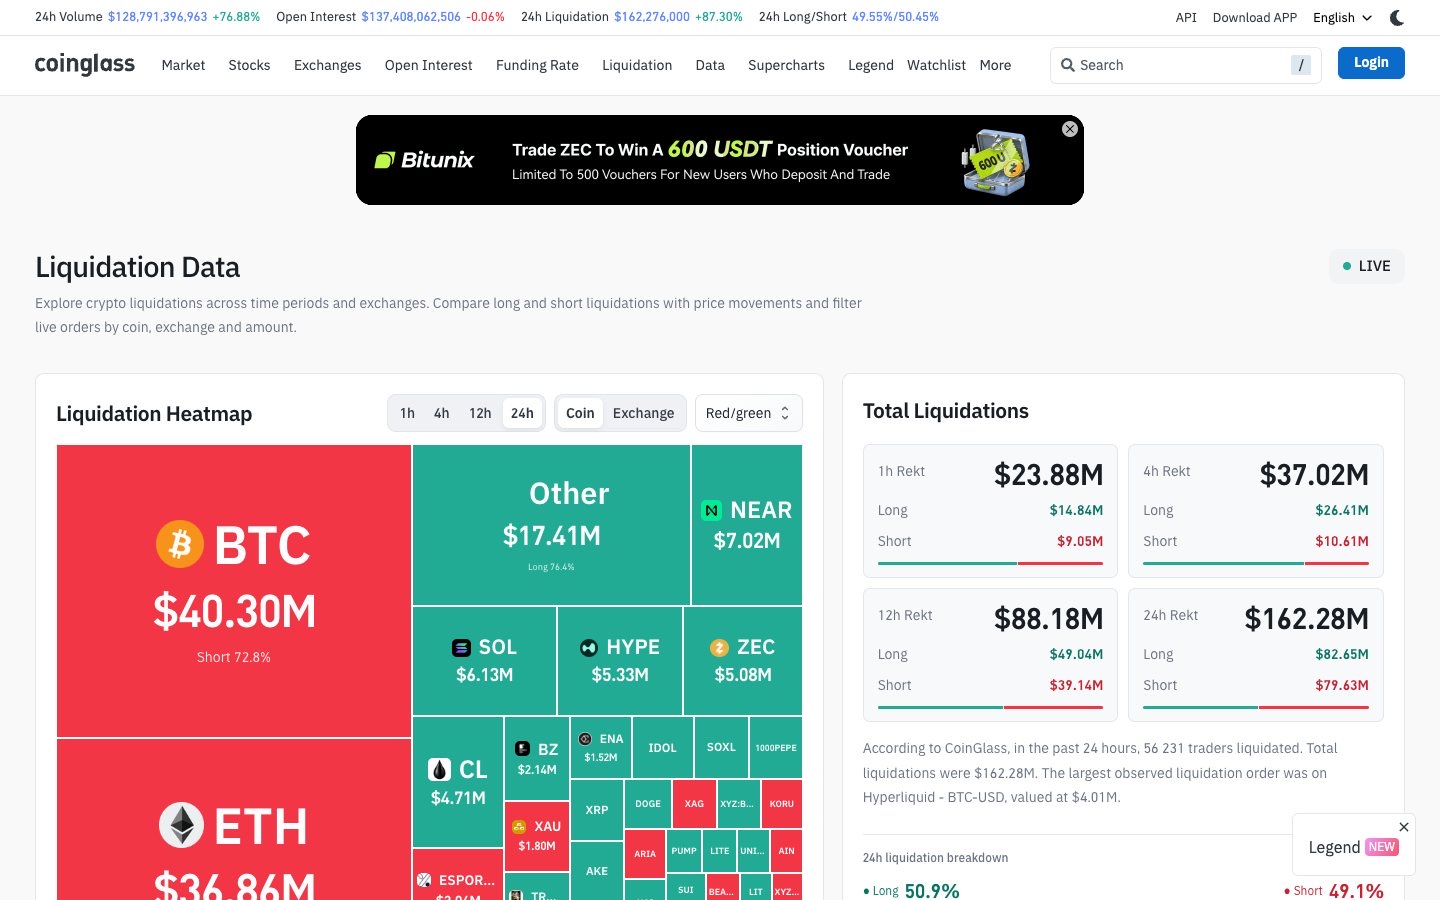
Follow the CoinGlass workflow from the input to the reported result. Start with confirm funding intervals and instrument identifiers; then record whether the output makes use of derivatives positioning, funding-rate series and liquidation estimates. If the data comes from another exchange, wallet or account, note that dependency explicitly. A screenshot can help explain the screen but does not independently verify the accuracy of every value it contains.
For CoinGlass, start with a constrained project: compare contract-normalized open interest on two venues. Then confirm funding intervals and instrument identifiers. Treat that as a repeatable acceptance test, not as a trading system. If the result depends on a feed, exchange or report format that is absent from your plan, do not infer that the paid tier will fix it without verifying the entitlement.
🧭 How to Evaluate CoinGlass Before Subscribing
1. Compare open interest across two major exchanges for the same contract
Evaluation note: Before starting this check, record the chosen instrument and session zone. Inspect whether saved settings remain consistent when the platform is reopened. Any mismatch should be described with an exact timestamp rather than dismissed as user error.
2. Check funding-rate timestamp and symbol normalization
Evaluation note: Run this check against a defined sample and record the limits of the account tier. If the feature is unavailable, note the subscription level rather than treating it as a software malfunction.
3. Inspect Prime model distinctions without treating heatmaps as trade triggers
Evaluation note: Keep a dated copy of the source input and the result. When external exchange or wallet data is involved, document that dependency so the same exercise can be attempted again.
4. Verify API historical limits before designing any external dashboard
Evaluation note: Compare the output with a second method or a manually checked subset. Explain any disagreement before using the result in a recommendation; a successful screenshot alone does not establish data accuracy.
🛠️ Key Features and Real-World Fit
✓ Derivatives open interest, funding and liquidation views
derivatives positioning, funding-rate series and liquidation estimates: the practical question for CoinGlass is whether a user can compare contract-normalized open interest on two venues. Compare the documented output with Glassnode where appropriate, and check liquidation heatmaps are model-based visualizations, not executable order books before treating the feature as a subscription benefit.
✓ Liquidation heatmaps and cross-exchange market dashboards
Liquidation heatmaps and cross-exchange market dashboards: the practical question for CoinGlass is whether a user can confirm funding intervals and instrument identifiers. Compare the documented output with TradingView where appropriate, and check exchange coverage and historical depth vary by metric and api tier before treating the feature as a subscription benefit.
✓ Prime heatmap access and expanded model features
Prime heatmap access and expanded model features: the practical question for CoinGlass is whether a user can inspect Prime model distinctions without treating heatmaps as trade triggers. Compare the documented output with CryptoQuant where appropriate, and check prime features for the heatmap may be web-only; api access is separately priced before treating the feature as a subscription benefit.
✓ Separate API offering for programmatic crypto market data
Separate API offering for programmatic crypto market data: the practical question for CoinGlass is whether a user can verify API historical limits before designing any external dashboard. Compare the documented output with Glassnode where appropriate, and check liquidation heatmaps are model-based visualizations, not executable order books before treating the feature as a subscription benefit.
⚠️ Limitations and Accuracy Risks
- Liquidation heatmaps are model-based visualizations, not executable order books
- Exchange coverage and historical depth vary by metric and API tier
- Prime features for the heatmap may be web-only; API access is separately priced
For CoinGlass, the warning about exchange coverage and historical depth vary by metric and api tier deserves a concrete example before publication. Check inspect Prime model distinctions without treating heatmaps as trade triggers. If this fails, identify whether the cause is a missing plan entitlement, incompatible input or out-of-date documentation. Do not substitute a generalized claim that all platforms are unreliable, because the specific limitation is what helps a buyer.
💰 CoinGlass Pricing and Total Ownership Cost
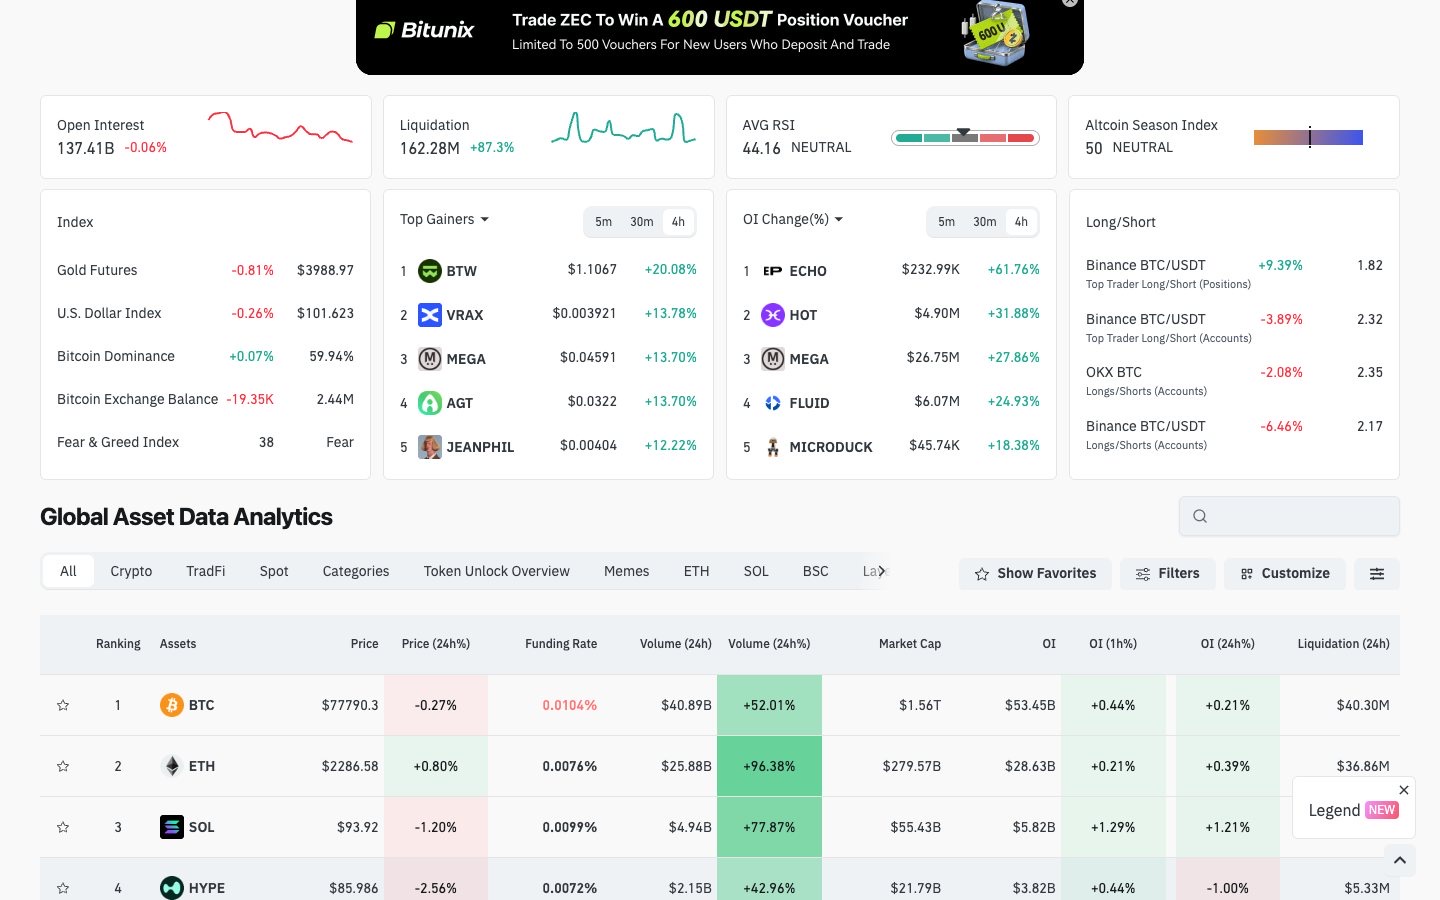
CoinGlass Prime is listed at $28 per month or $268 per year, while a separate CoinGlass data API has its own pricing (Hobbyist starts at $29/month). The Prime website subscription and API license should not be confused.
Build the CoinGlass budget from the vendor’s current plan page, the required feature derivatives positioning, funding-rate series and liquidation estimates and any data or report limits connected to liquidation heatmaps are model-based visualizations, not executable order books. Compare the actual monthly checkout against the yearly amount paid up front. Where an API or third-party licence is required, treat that as a separate cost rather than an included benefit. Set a calendar reminder for renewal, but do not assume a discounted first year will repeat.
| Cost question | What to verify | Why it matters |
| Billing cycle | Monthly and annual checkout totals | Effective monthly rates can require a year of commitment |
| Data access | Asset coverage, exchange entitlements and history | A missing feed may invalidate your workflow |
| Usage caps | Charts, alerts, exports, API calls or transaction counts | Limits can interrupt an otherwise useful test |
| Commercial rights | Personal, team or commercial data usage | A personal plan may not permit publishing or redistribution |
| Cancellation | Trial conversion and renewal date | Avoid paying for an unused tool |
🎯 Who Should Use CoinGlass?
The strongest potential fit is someone actively working on crypto market analytics, with enough regular use to justify the subscription. That person should be able to identify a specific recurring problem, choose a success metric and confirm access to the correct data and export format.
CoinGlass is less attractive when a buyer does not regularly use liquidation heatmaps and cross-exchange market dashboards or cannot explain the information needed from compare contract-normalized open interest on two venues. The interface may be extensive without producing a useful record. In that situation, a free chart, a spreadsheet or a narrower competing product can be sufficient. The useful comparison is actual work completed against total annual cost, not the number of dashboards.
⚖️ CoinGlass Alternatives and Comparisons
| Platform | Primary decision dimension | What to check |
| CoinGlass | Crypto Market Analytics | Vendor plan features, data coverage and total cost |
| Glassnode | Different approach to the same task | Workflow and data comparability |
| TradingView | Specialised research or journal tools | Integration and output needs |
| CryptoQuant | Complementary tool or workflow | Whether it replaces or supplements the stack |
Compare CoinGlass against Glassnode with the same instrument, historical window and output requirement. A second candidate such as TradingView may solve only one part of the process. If the job is confirm funding intervals and instrument identifiers, record which product completes it with fewer undocumented assumptions. Comparing a journal to a screener simply because both concern markets does not establish that one is superior.
🔎 CoinGlass in Practice: Detailed Research Notes
A realistic research session
A CoinGlass research session should begin with a precise derivatives question: has aggregate open interest increased while price moved, and which venues contributed? Choose a defined contract or group of contracts, record the timestamp and compare the exchange breakdown. Then look at funding and liquidations as separate indicators. The numbers may come from instruments with different contract sizes or settlement currencies, so aggregation rules matter. A trader who reads every colored band on a liquidation heatmap as a guaranteed price target can draw a much stronger conclusion than the data permits. The useful output is a documented observation with clear caveats.
Which features change the work?
CoinGlass covers futures positioning, open interest, funding and liquidation data across crypto venues. Prime emphasizes expanded web or app heatmap models, while a separate API product addresses programmatic access to datasets. That distinction matters for readers building dashboards: buying Prime does not automatically give an API integration the right to use the same data. Liquidation heatmaps are estimates of potential concentrated leverage, not a record of orders waiting at a visible price. Their visual intensity depends on model assumptions that may differ across versions. Read the legend and observation window before drawing comparisons between screenshots.
Market data, definitions and timing
Exchange coverage is more important than a large aggregate number. Some contracts are margined and quoted differently, and venues can report nominal exposure under different conventions. If you compare a perpetual future to a dated futures contract, the funding series and settlement mechanics are not interchangeable. Live feeds can also contain delays or outages. When recording a snapshot, preserve the symbol, venue, unit, timestamp and selected interval. For historical work, check whether the metric available through the website matches the API endpoint and depth in the subscribed tier. An unavailable endpoint is not evidence that a historical observation never occurred.
The subscription decision
CoinGlass’s official Prime subscription lists $28 per month, $78 per quarter and $268 per year, with a non-refundable warning. The API is marketed separately, starting with a Hobbyist tier at $29 per month, followed by more capable and commercially licensed tiers. A researcher who only inspects the website should not assume they need API access. Conversely, a team creating an internal alert service must check request limits and redistribution rights even if the Prime interface already shows the same graph. Avoid treating promotional annual savings as the total cost of a data-driven application without accounting for API limits and usage.
How it compares with alternatives
Glassnode addresses a different slice of crypto research: on-chain activity and broader market intelligence across observable blockchain data. CoinGlass is especially relevant to exchange derivatives positioning and liquidation tools. TradingView can show crypto price charts and some market indicators but is not a substitute for every exchange-level derivatives dataset. CryptoQuant and Dune can offer other analytical perspectives depending on the metric and the level of data manipulation required. Compare one concrete question, such as a change in aggregate open interest, across providers and document why their definitions differ before treating the mismatch as evidence of faulty data.
Where an attractive dashboard can mislead
A dramatic liquidation graphic can create a false sense of certainty. Markets can change positions, reduce leverage or shift liquidity before any price move occurs, and the map generally reflects a model rather than an executable order book. Historical figures can also be revised after exchange outages or data corrections. Avoid calling a modeled heatmap value a verified liquidation event. For every chart shared publicly, keep the timestamp, symbol, selected period and description of the relevant metric. The software may explain market structure, but it is not a forecast of where price must go next.
🔍 Related CoinGlass Questions Worth Checking
CoinGlass Prime vs free is a website-feature comparison, not an API licence comparison. The CoinGlass open interest dashboard can combine derivatives from venues with different contract conventions, so keep the unit and timestamp visible. CoinGlass Prime pricing should be checked separately from any programmatic data-access plan.
Interpret CoinGlass funding rate data with the exchange and settlement interval recorded. For CoinGlass liquidation map accuracy, remember that heatmaps represent model-dependent estimates, not guaranteed orders sitting at a fixed price. A CoinGlass liquidation heatmap is useful for market context but cannot establish where price must move.
Before relying on CoinGlass BTC market data, identify whether the value is spot, perpetual or dated-futures exposure. CoinGlass exchange coverage determines how complete an aggregate number is. A researcher working in crypto market analytics needs that methodological detail before comparing a displayed volume with another provider.
The CoinGlass API personal license may have different conditions from a team or commercial subscription. CoinGlass Prime yearly cost also differs from CoinGlass API pricing; do not sum or compare them as if they were identical products. An API-driven dashboard needs its own review of usage caps and redistribution rights.
For CoinGlass historical crypto data, confirm the endpoint, instrument and observation interval. A CoinGlass vs Glassnode comparison should separate derivatives-positioning metrics from on-chain address and transaction measures. The sensible next step is to reproduce one documented observation in each product, not to assume the more visually striking chart provides a stronger trading signal.
🔬 CoinGlass — Practical Product Analysis
Open interest is an aggregate, not a universal position count
CoinGlass makes it convenient to follow funding, open interest and liquidation-related views across crypto derivatives exchanges. But contracts do not all express exposure in the same units. Some instruments are coin-margined, some are stablecoin-margined, and dated futures have mechanics that differ from perpetual swaps. Before comparing two exchanges, inspect the contract definition and decide whether the desired value is notional exposure, number of contracts or another normalized measure. A sudden change in an aggregated total can reflect listing changes, changes in contract valuation or venue coverage as well as actual market activity. A useful dashboard annotation records the selected interval and unit.
Funding rates need equally careful timestamps. A displayed positive rate on one venue does not mean every position across exchanges pays the same amount at the same moment. Different settlement windows, funding calculations and instrument identifiers complicate direct comparisons. A researcher studying a spike in funding should document the specific market, settlement schedule and interval instead of labeling it simply as 'bullish sentiment.' The combination of price movement and open interest can offer context, but neither series alone tells you whether newly opened positions belong to buyers or sellers in the way a simplistic trading signal might imply.
What a liquidation heatmap estimates
CoinGlass Prime offers access to its liquidation heatmap models and automated refresh. The chart is a model-based representation of potential liquidation clusters under assumed leverage and positioning, not an exchange order book containing guaranteed executable orders. A bright band above the market can disappear or change if positions are closed, new trades arrive or the model's inputs update. That is why a heatmap cannot establish that price must visit a level. A responsible software review should explain this difference before discussing the attraction of highly visual analytics.
Compare Model 1, Model 2 and Model 3 using the same symbol and observation time rather than assuming that the brightest display is the most accurate. A visualized estimate should not be described as a verified historical liquidation event unless supported by actual exchange data. Use the chart alongside context such as funding and open interest, and save the timestamp. Historical screenshots are especially vulnerable to misinterpretation because they do not reveal which assumptions were available at the time of the market move.
Website Prime versus the separate API
The official Prime page currently lists $28 monthly, $78 quarterly and $268 annually, describing website and app access to liquidation models and stating that subscriptions are non-refundable. This is separate from CoinGlass API products. A developer who wants to store market data or supply an external signal engine should check API endpoint entitlements, rate limits, commercial rights and historical coverage independently. Paying for a visual heatmap subscription does not automatically authorize bulk redistribution or programmatic extraction of the same underlying data.
Compared with Glassnode, CoinGlass has a stronger emphasis on derivatives positioning and liquidation maps; Glassnode concentrates on on-chain and integrated market metrics. TradingView adds price-chart and study workflows but does not replace every specialist derivatives dataset. A buyer should decide whether the actual research question is about futures leverage, blockchain holder behavior or price-based chart rules. Treat these as complementary datasets rather than competitors ranked only by the number of charts or the spectacle of a heatmap.
Further decision considerations
Funding and open interest together can give a more nuanced picture than either alone. If price rises while aggregate open interest falls, one possible explanation is that some short positions closed; it is not proof that new spot buyers dominated, because the aggregate series may also reflect instrument mix and reporting changes. Likewise, a funding-rate spike can result from temporary imbalance rather than a durable directional view. A responsible CoinGlass article should name these alternative interpretations and discourage drawing a trade conclusion from a single bright color on the screen.
For a data-team use case, compare Prime's visual access with the corresponding API scope before budgeting. A website user may need only occasional market inspection, while a developer wants reproducible endpoints, historical periods and a documented retry strategy. API response limits and commercial use rights can dominate the total cost. A subscription that makes sense for an individual trader may not support automated redistribution of the same charts in a commercial publication. An independent test can also compare a saved heatmap image with the identical contract several hours later. If the highlighted band changes, record whether the observation window or model selection was the same. That exercise demonstrates why a historical graphic should not be treated as a static prediction.
One More Practical Research Consideration
A modelled liquidation band should be accompanied by a clear legend and an observation date when shared in a research article. Looking at the same chart several hours later is not a valid test unless the symbol, venue coverage, time window and selected model also remain constant. Otherwise the apparent disappearance of a cluster may be explained by different settings rather than changing leveraged positions. This is a useful distinction for teams that archive screenshots for review meetings. The purpose of the image is to preserve what the analytical tool displayed at a known moment, not to imply a certainty about a future price move.
🧪 How DigiOffly Evaluates This Software
- Compare open interest across two major exchanges for the same contract
- Check funding-rate timestamp and symbol normalization
- Inspect Prime model distinctions without treating heatmaps as trade triggers
- Verify API historical limits before designing any external dashboard
For CoinGlass, our proposed test log includes the plan used, the date, the evidence for inspect prime model distinctions without treating heatmaps as trade triggers, and any constraint from prime features for the heatmap may be web-only; api access is separately priced. These are proposed checks; our current documentation does not establish the results of an independent benchmark. A legitimate revision should link the screenshot, the source record and a clear description of what was and was not verified.
🏆 Final Verdict: CoinGlass Software Review
CoinGlass deserves consideration when its specific features address a documented research or workflow requirement. The main decision remains practical: can you reproduce the result with the data and access included in the plan, and is the recurring cost lower than the time and errors the software can reasonably prevent? CoinGlass can help analysts view derivatives positioning through a consistent dashboard, but a liquidation cluster is a statistical map rather than a promise that price will trade there. Compare exchange coverage and freshness for the markets you actually use. Avoid mixing Prime website access with CoinGlass's paid API terms.

Frequently Asked Questions
What does CoinGlass do?
CoinGlass is designed around crypto market analytics. Its primary use depends on the features and data you activate.
Is CoinGlass free?
Review the current trial and free-access conditions on CoinGlass’s official site. Do not assume that a marketing preview includes all paid datasets or that a trial will remain free indefinitely.
How much does CoinGlass cost in 2026?
Prime website access has separate monthly and annual pricing; CoinGlass API access is a different product and fee. Check the pricing source linked above for the current region, billing cycle and conditions.
Is CoinGlass suitable for beginners?
A beginner can start with one narrow workflow, but should verify terminology, plan restrictions and whether a free alternative meets the need.
Does CoinGlass guarantee profitable trading?
No. Research, charting, journals and backtests cannot guarantee financial outcomes; hypothetical results have important limitations.
What market data does CoinGlass include?
Coverage and history are product- and tier-specific. Check the exact instrument, venue, time interval, licence and data-refresh terms.
Can I use CoinGlass for crypto, forex or stocks?
Check the official supported markets and feature matrix. Product support may differ from the availability of paid real-time exchange feeds.
Can I export my research from CoinGlass?
Review the export, API, CSV and reporting entitlements of the chosen plan. Data licences may limit redistribution.
What are the biggest limitations of CoinGlass?
Liquidation heatmaps are model-based visualizations, not executable order books; Exchange coverage and historical depth vary by metric and API tier; Prime features for the heatmap may be web-only; API access is separately priced.
What are alternatives to CoinGlass?
Start with Glassnode, TradingView, CryptoQuant and compare a consistent task, current pricing and market coverage.
What should I verify before paying for CoinGlass?
Confirm data entitlements, annual versus monthly billing, taxes, usage caps, cancellation and the outputs you actually need.
EXPLORE NEXT ON DIGIOFFLY
🔍 Explore More on DigiOffly
After the CoinGlass review: A derivatives dashboard, a crypto price chart and an API data pipeline have different costs. Use these resources before combining them into one research stack.
Compare the right tools
- Software Finder — Distinguish derivatives analysis from charts and portfolio accounting.
- Compare Software — Structure a shortlist by data coverage, history and licensing.
- Software directory — Browse our published software guides beyond market-data dashboards.
Plan your software budget
- Software Cost Calculator — Model Prime web access separately from any licensed API tier.
- Software Stacks — Plan charting, specialist metrics and data transport as distinct tools.
- Verified software deals — Check current data-plan offers and cancellation terms.
Read related guides
- Postman review — Test API endpoint responses and authentication for data workflows.
- Datadog review — Explore monitoring concepts when operating a market-data pipeline.
- Editorial Standards — See our approach to limitations and unverified predictive claims.
- Trading & Market Analysis — Compare crypto and trading research tools
- Glassnode review — Research on-chain metrics rather than derivatives positioning
- TradingView review — Move from derivatives data to technical charts