

Vendor information reviewed 2 November 2026. Plan details and known add-on charges are explained in the pricing section, with a direct link to the source. Current vendor pricing.
Editorial disclosure: This is a software and pricing research draft based on the linked vendor documentation, not a claim of a completed personal product benchmark or trading outcome. We do not provide investment, financial or tax advice.
Glassnode specializes in derived measures of blockchain activity and market behavior. Its dashboard can describe holder cohorts, supply movement and cost-basis patterns, but the definitions of an address, entity and exchange wallet deserve careful attention. A precise chart should not encourage a reader to attribute motives to transactions that might reflect custodial maintenance.
The plan matrix and data delivery limits are publicly described, but this review does not claim to have run an independent point-in-time benchmark across the full history. That distinction matters for metrics that may be revised as address labels or classification rules improve. A historical curve exported today is not necessarily identical to the data originally available on every past date.
📊 Glassnode Review Summary
Best-fit use: Crypto Market Analytics. Pricing model: paid plans and potential additional data or usage charges. Check the full pricing breakdown below.
Advanced is a plausible entry tier for a person researching recent daily-resolution crypto metrics. A team studying many market cycles or needing frequent API delivery might require the longer history and wider catalogue of Professional. The annual price difference is substantial. Selecting a tier without first identifying the required metric and history would be an expensive mistake.
⚡ Quick Verdict: Is Glassnode Worth It?
The practical distinction for Glassnode is between on-chain supply measures and holder-cohort charts and what a user can validate from the selected plan. The decisive caveat is metric definitions require care; exchange labels can be revised. Compare that with CoinGlass before making an annual commitment.
Glassnode is not a replacement for exchange derivatives data or basic charting. CoinGlass emphasizes futures positioning, while TradingView offers price-chart and script workflows. A research team should decide what unit of observation it needs—wallet activity, futures contracts or price bars—before comparing those services on cost.
🧠 What Is Glassnode?
Glassnode is a platform in the Crypto Market Analytics software category. Its relevant published capabilities include on-chain supply measures and holder-cohort charts; historical metrics and customizable studio charting; research alerts and export or api pathways by plan; derived metrics such as mvrv and cost-basis distributions. This makes it part of the broader trading-software stack, but it should not be confused with a guarantee of successful trades, a regulated investment recommendation or a substitute for evaluating market-data licensing.
A suitable Glassnode buyer has a defined task: inspect the definitions of two selected blockchain measures. A person needing research alerts and export or api pathways by plan may face a different licensing decision from someone who only reads weekly research. Name the instrument, expected export and budget before choosing a subscription tier. This avoids comparing products with different purposes as though their feature lists were directly interchangeable.
🖥️ Interface, Data and Day-to-Day Workflow
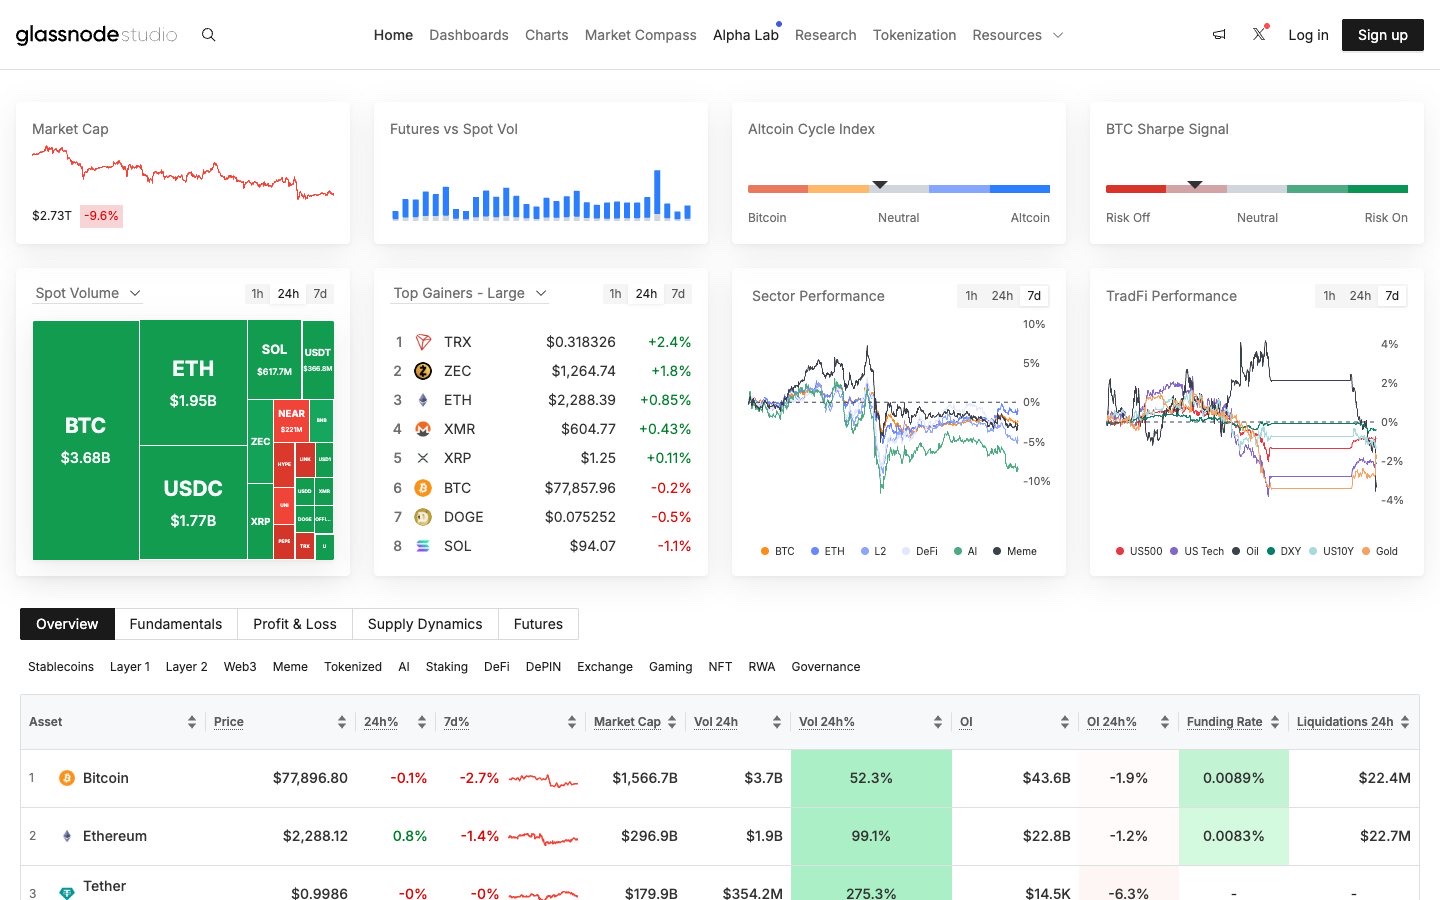
Follow the Glassnode workflow from the input to the reported result. Start with verify the required asset coverage and history under Advanced; then record whether the output makes use of on-chain supply measures and holder-cohort charts. If the data comes from another exchange, wallet or account, note that dependency explicitly. A screenshot can help explain the screen but does not independently verify the accuracy of every value it contains.
For Glassnode, start with a constrained project: inspect the definitions of two selected blockchain measures. Then verify the required asset coverage and history under Advanced. Treat that as a repeatable acceptance test, not as a trading system. If the result depends on a feed, exchange or report format that is absent from your plan, do not infer that the paid tier will fix it without verifying the entitlement.
🧭 How to Evaluate Glassnode Before Subscribing
1. Open two on-chain metrics and inspect source definitions
Evaluation note: Before starting this check, record the chosen instrument and session zone. Inspect whether saved settings remain consistent when the platform is reopened. Any mismatch should be described with an exact timestamp rather than dismissed as user error.
2. Check whether desired assets and history exist in Advanced
Evaluation note: Run this check against a defined sample and record the limits of the account tier. If the feature is unavailable, note the subscription level rather than treating it as a software malfunction.
3. Verify alert and export limits against a documented workflow
Evaluation note: Keep a dated copy of the source input and the result. When external exchange or wallet data is involved, document that dependency so the same exercise can be attempted again.
4. Use point-in-time series where backtest reproducibility matters
Evaluation note: Compare the output with a second method or a manually checked subset. Explain any disagreement before using the result in a recommendation; a successful screenshot alone does not establish data accuracy.
🛠️ Key Features and Real-World Fit
✓ On-chain activity, holder behavior and market data dashboards
on-chain supply measures and holder-cohort charts: the practical question for Glassnode is whether a user can inspect the definitions of two selected blockchain measures. Compare the documented output with CoinGlass where appropriate, and check metric definitions require care; exchange labels can be revised before treating the feature as a subscription benefit.
✓ Historical metrics and customizable Studio charting
Historical metrics and customizable Studio charting: the practical question for Glassnode is whether a user can verify the required asset coverage and history under Advanced. Compare the documented output with CryptoQuant where appropriate, and check advanced is intended for personal use and commercial licences differ before treating the feature as a subscription benefit.
✓ Research alerts and export or API pathways by plan
Research alerts and export or API pathways by plan: the practical question for Glassnode is whether a user can verify alert and export limits against a documented workflow. Compare the documented output with Dune where appropriate, and check deeper history, higher resolution and data delivery are tier-dependent before treating the feature as a subscription benefit.
✓ Derived metrics such as MVRV and cost-basis distributions
Derived metrics such as MVRV and cost-basis distributions: the practical question for Glassnode is whether a user can use point-in-time series where backtest reproducibility matters. Compare the documented output with CoinGlass where appropriate, and check metric definitions require care; exchange labels can be revised before treating the feature as a subscription benefit.
⚠️ Limitations and Accuracy Risks
- Metric definitions require care; exchange labels can be revised
- Advanced is intended for personal use and commercial licences differ
- Deeper history, higher resolution and data delivery are tier-dependent
For Glassnode, the warning about advanced is intended for personal use and commercial licences differ deserves a concrete example before publication. Check verify alert and export limits against a documented workflow. If this fails, identify whether the cause is a missing plan entitlement, incompatible input or out-of-date documentation. Do not substitute a generalized claim that all platforms are unreliable, because the specific limitation is what helps a buyer.
💰 Glassnode Pricing and Total Ownership Cost
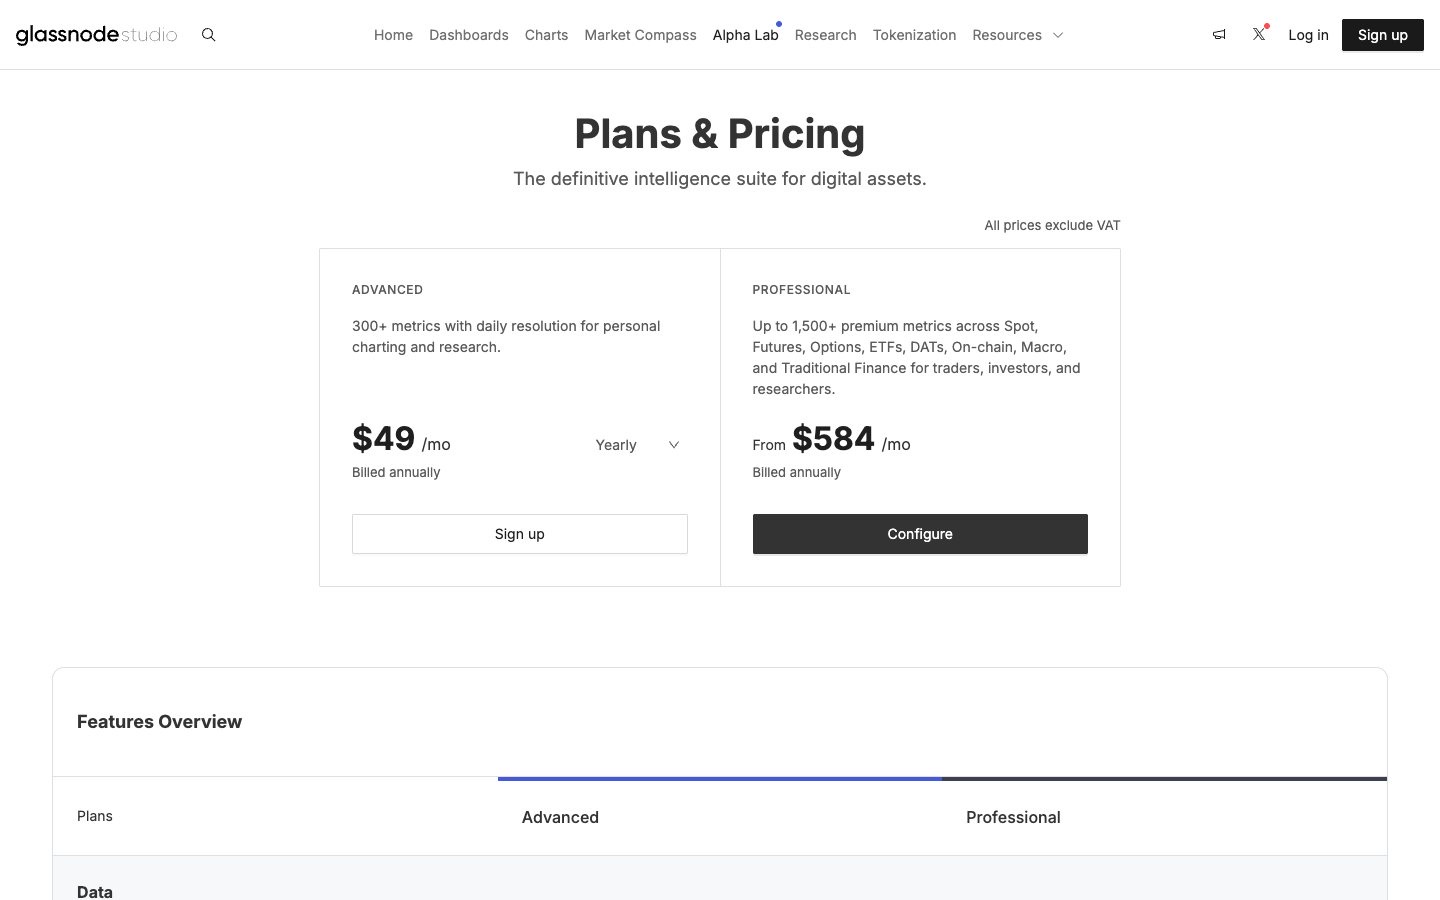
Glassnode Studio Advanced is advertised at $49/month when billed annually, with 300+ daily-resolution metrics and four years of Studio history. Professional is configured separately for greater history, resolution, and commercial rights; pricing and API-credit add-ons require a quote.
Build the Glassnode budget from the vendor’s current plan page, the required feature on-chain supply measures and holder-cohort charts and any data or report limits connected to metric definitions require care; exchange labels can be revised. Compare the actual monthly checkout against the yearly amount paid up front. Where an API or third-party licence is required, treat that as a separate cost rather than an included benefit. Set a calendar reminder for renewal, but do not assume a discounted first year will repeat.
| Cost question | What to verify | Why it matters |
| Billing cycle | Monthly and annual checkout totals | Effective monthly rates can require a year of commitment |
| Data access | Asset coverage, exchange entitlements and history | A missing feed may invalidate your workflow |
| Usage caps | Charts, alerts, exports, API calls or transaction counts | Limits can interrupt an otherwise useful test |
| Commercial rights | Personal, team or commercial data usage | A personal plan may not permit publishing or redistribution |
| Cancellation | Trial conversion and renewal date | Avoid paying for an unused tool |
🎯 Who Should Use Glassnode?
The strongest potential fit is someone actively working on crypto market analytics, with enough regular use to justify the subscription. That person should be able to identify a specific recurring problem, choose a success metric and confirm access to the correct data and export format.
Glassnode is less attractive when a buyer does not regularly use historical metrics and customizable studio charting or cannot explain the information needed from inspect the definitions of two selected blockchain measures. The interface may be extensive without producing a useful record. In that situation, a free chart, a spreadsheet or a narrower competing product can be sufficient. The useful comparison is actual work completed against total annual cost, not the number of dashboards.
⚖️ Glassnode Alternatives and Comparisons
| Platform | Primary decision dimension | What to check |
| Glassnode | Crypto Market Analytics | Vendor plan features, data coverage and total cost |
| CoinGlass | Different approach to the same task | Workflow and data comparability |
| CryptoQuant | Specialised research or journal tools | Integration and output needs |
| Dune | Complementary tool or workflow | Whether it replaces or supplements the stack |
Compare Glassnode against CoinGlass with the same instrument, historical window and output requirement. A second candidate such as CryptoQuant may solve only one part of the process. If the job is verify the required asset coverage and history under Advanced, record which product completes it with fewer undocumented assumptions. Comparing a journal to a screener simply because both concern markets does not establish that one is superior.
🔎 Glassnode in Practice: Detailed Research Notes
A realistic research session
A Glassnode workflow might focus on whether long-term Bitcoin holders are accumulating or distributing during a defined market period. Before drawing conclusions, choose a metric with a published definition, verify its update resolution and inspect whether its historical values can be revised. Compare related series rather than interpreting a single line in isolation. A rise in address activity, for example, cannot automatically be translated into a matching number of unique investors. More useful questions are about methodology: what does the metric count, how are entities grouped and how far back does the data remain comparable?
Which features change the work?
Glassnode Studio combines on-chain and market metrics with charting, alerts and research resources. Advanced provides access to a defined subset of daily-resolution indicators; Professional targets broader coverage, deeper history and different usage rights. A catalogue of hundreds of metrics is useful only when the underlying definitions are understandable. MVRV and cost-basis distributions are examples of derived measures that can help describe market context but should not be interpreted as direct buy or sell instructions. A review should connect each metric to the decision it informs and note where assumptions about entity clustering or spending behavior limit interpretation.
Market data, definitions and timing
Blockchain observations have their own data-quality problems. Exchanges may move assets between internal wallets, addresses may be clustered differently over time and service labels can be updated. A historical value available today may not have been identical at the time a backtest would have consumed it. Point-in-time availability matters as much as the length of the historical chart. Glassnode Advanced advertises four years of Studio history at daily resolution, with Professional offering deeper histories and potentially faster updates. Verify the required asset, interval and metric licensing before building an automated model around the data.
The subscription decision
Glassnode publishes Advanced at $49 per month when billed annually, excluding VAT, with a personal-use emphasis. Professional is configured for wider datasets and higher-resolution work; price and credits vary by contract. These two routes should not be compared solely by the number of chart panels. A researcher who reads weekly Bitcoin charts may only need a few well-defined daily indicators, whereas an API-driven team can quickly reach download or history limits. Check API access, export counts, commercial rights and cancellation or renewal before taking the annual headline figure as the total expenditure.
How it compares with alternatives
CoinGlass concentrates on crypto derivatives data such as open interest, funding and liquidation visualization, while Glassnode emphasizes chain-derived metrics and integrated research datasets. Dune may suit analysts who want to create custom queries over blockchain data, but that comes with a different level of technical setup. TradingView can provide price-chart context without necessarily providing all of Glassnode’s specialized metrics. Ask what evidence a metric actually adds. If you already have price and volume, a costly on-chain subscription is justified only if its separate data materially informs a repeatable research question.
Where an attractive dashboard can mislead
The most common interpretive error is attributing motive to an aggregate blockchain measure. A large transfer may reflect exchange internal accounting, collateral management or a custodial movement rather than the behavior implied by a headline. Metrics based on entity labels are estimates with changing coverage. When writing about historic on-chain signals, separate a backfilled series from the value that was available on the day in question. A good review states the metric, resolution, data-vintage limit and what cannot be inferred. Glassnode can clarify crypto context; it cannot prove a market turning point by itself.
🔍 Related Glassnode Questions Worth Checking
Glassnode Advanced vs Professional is chiefly a question about metric coverage, resolution, history and commercial usage. Check Glassnode 2026 pricing for the contract actually needed, not just the lowest effective monthly figure. A Glassnode Studio chart is most useful when its underlying metric definition is linked and understood.
A Glassnode MVRV chart combines assumptions about realized and market value; readers should not treat a threshold as an automatic trading instruction. Glassnode API access matters only if the researcher will actually query and store data. For on chain analytics software, point-in-time data availability and later revisions should be documented before conducting a backtest.
Evaluate Glassnode Studio history against the length of the cycle being investigated. Glassnode onchain metrics may change when exchange or entity labels are revised. The resulting historical series can be useful, but a current chart may not represent exactly what an analyst knew on the earlier date.
For Glassnode BTC research, compare related metrics with the same date range rather than isolating one dramatic reading. Glassnode alerts limits should be checked in the chosen plan before designing an automated monitoring routine. This is research context and not an independently tested trading signal.
A Glassnode commercial data license can involve different rights from individual chart access. When asking Glassnode vs CoinGlass, decide whether the problem is tracking transactions on-chain or monitoring derivatives positioning across exchanges. The strongest Glassnode alternatives are those that answer the same metric question with transparent definitions and appropriate data rights.
🔬 Glassnode — Practical Product Analysis
On-chain activity and the difference between addresses and entities
Glassnode Studio provides blockchain-derived and market indicators, including holder behavior, supply metrics and valuation ratios. An address is not necessarily a single investor; exchanges, custodians and services can control multiple addresses, while one transaction may reflect internal wallet management rather than a meaningful market decision. Metrics based on entity clustering therefore have interpretation and revision limits. If a chart suggests accumulation or distribution, check the method, the asset, the time resolution and whether wallet labels were revised. The interface helps explore this evidence, but the existence of a precise-looking line is not itself evidence that a market turning point has been identified.
Consider MVRV as an example. It compares market value with a form of realized value built from historical on-chain price information. A high or low reading may be useful for studying previous cycles, but a fixed cutoff is not a universal buy or sell signal. The calculation and historical coverage should be checked before a researcher attributes predictive power to it. Similarly, a sudden increase in exchange inflows might reflect custody changes or internal reorganizations. An article can explain what the metric measures without assigning intent to every transaction that contributes to the number.
History, resolution and point-in-time research
Glassnode currently advertises Advanced at $49 per month when billed annually, with more than 300 daily-resolution metrics and four years of Studio history. The Professional tier starts from a materially higher annual-billing equivalent, offers a wider catalogue and potentially much longer history and finer resolution depending on configuration. This difference matters when someone wants to research multiple Bitcoin cycles: four years of history may be insufficient for a long-horizon backtest. Do not treat the most expensive product as essential without checking which exact indicators and intervals the project uses.
Historical data can be revised after a new exchange label, entity classification or data-processing change. That is a critical issue for quantitative work: the series downloaded today may not match the values an analyst could have known on a date years earlier. A credible strategy study needs point-in-time access or a clear statement about revision risk. When evaluating Studio, compare current chart exports with the relevant API definitions and note how many updates and history years each plan allows. CSV availability does not imply that every historical data vintage can be recovered.
Data delivery rights and a valid software comparison
The current pricing matrix lists API Light for Advanced, with limited history, daily resolution and a daily request/download quota. Professional uses a credit-based framework and supports broader data-delivery options, subject to the chosen configuration. Researchers publishing charts commercially must check licence terms, not only whether a download button is visible in their personal account. An annual subscription can be a poor choice if the project's workflow depends on unavailable metrics or redistribution rights. Confirm data coverage and permitted use before building a dashboard around one vendor's charts.
CoinGlass is useful for exchange derivatives positioning and modelled liquidation zones; Glassnode addresses a different question through blockchain and broader market metrics. Dune may fit a team comfortable writing custom blockchain queries, but it has its own data engineering and licensing considerations. A realistic comparison asks one research question—such as how holder cost basis or exchange activity evolved over a specified interval—then identifies which provider supplies a transparent definition and sufficiently long history. Colorful visualizations alone cannot decide which source is analytically appropriate.
Further decision considerations
A researcher studying earlier Bitcoin cycles needs to know whether the comparison period falls inside Advanced's four-year Studio history. If a desired observation is older, a Professional configuration or another data source may be necessary; simply extrapolating a newer pattern would not answer the historical question. Even where the history exists, distinguish a chart's current backfilled values from figures available at the time. This is a methodological limitation, not a cosmetic concern. A convincing report should cite the metric definition, source, interval and data extraction date alongside any chart.
Glassnode's daily resolution is adequate for some long-horizon holder studies but not for every intraday signal. A chart of realized-value distributions cannot by itself tell a trader how a five-minute bar will close. When contrasting Glassnode with CoinGlass or TradingView, identify the unit of observation: address or entity aggregates, derivatives contracts, or market price bars. These are different measurements and should not be presented as if they are interchangeable forecasts. A researcher must also distinguish nominal metric availability from the availability of a licensed historical download. The vendor may show a chart in the interface while limiting API resolution or history under a particular plan. The actual permitted workflow therefore determines subscription value.
One More Practical Research Consideration
The phrase 'long-term holders' also depends on a specific metric methodology. A supply-aging threshold, a wallet grouping model and the handling of exchange addresses can lead different providers to describe different populations with similar labels. Before comparing two charts, inspect the definitions rather than assuming they count identical coins or entities. A research note should give the date and resolution of the exported value, not just the latest plotted endpoint. Those details help explain why a later download could produce a slightly different historical series without either dataset necessarily being fabricated.
🧪 How DigiOffly Evaluates This Software
- Open two on-chain metrics and inspect source definitions
- Check whether desired assets and history exist in Advanced
- Verify alert and export limits against a documented workflow
- Use point-in-time series where backtest reproducibility matters
For Glassnode, our proposed test log includes the plan used, the date, the evidence for verify alert and export limits against a documented workflow, and any constraint from deeper history, higher resolution and data delivery are tier-dependent. These are proposed checks; our current documentation does not establish the results of an independent benchmark. A legitimate revision should link the screenshot, the source record and a clear description of what was and was not verified.
🏆 Final Verdict: Glassnode Software Review
Glassnode deserves consideration when its specific features address a documented research or workflow requirement. The main decision remains practical: can you reproduce the result with the data and access included in the plan, and is the recurring cost lower than the time and errors the software can reasonably prevent? Glassnode focuses on contextual on-chain and market research more than direct chart execution. A proper evaluation checks metric definitions, coverage, history and how data updates or revises; historical revisions can matter greatly in backtests. A portfolio researcher may value this context even if they never trade a derivative.

Frequently Asked Questions
What does Glassnode do?
Glassnode is designed around crypto market analytics. Its primary use depends on the features and data you activate.
Is Glassnode free?
Review the current trial and free-access conditions on Glassnode’s official site. Do not assume that a marketing preview includes all paid datasets or that a trial will remain free indefinitely.
How much does Glassnode cost in 2026?
Studio Advanced advertises an effective $49/month on annual billing; Professional has a different licensing and pricing model. Check the pricing source linked above for the current region, billing cycle and conditions.
Is Glassnode suitable for beginners?
A beginner can start with one narrow workflow, but should verify terminology, plan restrictions and whether a free alternative meets the need.
Does Glassnode guarantee profitable trading?
No. Research, charting, journals and backtests cannot guarantee financial outcomes; hypothetical results have important limitations.
What market data does Glassnode include?
Coverage and history are product- and tier-specific. Check the exact instrument, venue, time interval, licence and data-refresh terms.
Can I use Glassnode for crypto, forex or stocks?
Check the official supported markets and feature matrix. Product support may differ from the availability of paid real-time exchange feeds.
Can I export my research from Glassnode?
Review the export, API, CSV and reporting entitlements of the chosen plan. Data licences may limit redistribution.
What are the biggest limitations of Glassnode?
Metric definitions require care; exchange labels can be revised; Advanced is intended for personal use and commercial licences differ; Deeper history, higher resolution and data delivery are tier-dependent.
What are alternatives to Glassnode?
Start with CoinGlass, CryptoQuant, Dune and compare a consistent task, current pricing and market coverage.
What should I verify before paying for Glassnode?
Confirm data entitlements, annual versus monthly billing, taxes, usage caps, cancellation and the outputs you actually need.
EXPLORE NEXT ON DIGIOFFLY
🔍 Explore More on DigiOffly
After the Glassnode review: On-chain history, API delivery and market charts are not interchangeable. Check data access and permitted use before committing to an annual research subscription.
Compare the right tools
- Software Finder — Clarify whether the task needs on-chain metrics, charts or analytics.
- Compare Software — Compare research tools by data source, history and export capabilities.
- Software directory — Explore further published software documentation and reviews.
Plan your software budget
- Software Cost Calculator — Account for annual billing, data credits and access restrictions.
- Software Stacks — Plan the research pipeline before buying overlapping dashboards.
- Verified software deals — Check whether short-term offers apply to the necessary data tier.
Read related guides
- Postman review — Learn how API client tools help validate data endpoints.
- Datadog review — Review monitoring and data-quality tooling for automated pipelines.
- Editorial Standards — See how we explain historical revisions and unsupported claims.
- Trading & Market Analysis — Explore all market data and trading reviews
- CoinGlass review — Compare on-chain research with derivatives positioning
- Koinly review — Keep investor transaction accounting distinct from market data