

Pricing and documentation reviewed November 6, 2026. This Amazon CloudWatch review is an independent, documentation-based buying guide, not a claim that DigiOffly logged into an AWS production account or ran a measured load test. Published AWS regional rates, telemetry volumes, free-tier eligibility and product names can change. Cross-check the official CloudWatch pricing and CloudWatch Omni pricing before enabling paid telemetry.
A monitoring dashboard can show green while a checkout flow fails for real customers. Meanwhile, verbose debug logs can add to the AWS bill even on a quiet day. Before choosing CloudWatch, test whether an alert leads your team to the affected service, dependency and relevant logs within a telemetry budget agreed before the pilot.
This Amazon CloudWatch review 2026 follows a failed request from the first alert to its log and trace, then compares the classic and OpenTelemetry billing routes. We also examine where Datadog or Sentry could solve a different part of the incident.
🧭 On this page
- [Quick verdict](#cw-verdict): who should choose CloudWatch, and who should not.
- [Monitoring capabilities](#cw-monitoring): metrics, alarms, logs and distributed traces.
- [AWS CloudWatch pricing](#cw-pricing): what each billing unit actually means.
- [Alternatives](#cw-comparison): CloudWatch vs Datadog vs Sentry.
- [Pilot and FAQ](#cw-pilot): a practical evaluation before paying.
📊 Amazon CloudWatch Review Summary
| Decision factor | Our assessment |
|---|---|
| Best fit | Teams primarily operating AWS infrastructure and applications |
| Pricing model | Usage-based: different charges for logs, metrics, alarms, queries, telemetry and advanced features |
| Free tier | Certain monthly allowances exist; not an unrestricted free plan |
| Notable strength | Native connections to EC2, ECS, Lambda and other AWS resources |
| Primary risk | Data volume, metric cardinality and enabled features can make total spend difficult to forecast |
| Best alternative for broader SaaS observability | Datadog, especially for multi-vendor estates |
| Best alternative for app-centric exceptions | Sentry, especially for developer issue triage |
| Evidence standard | AWS documentation and published pricing, with a recommended hands-on pilot |
⚡ The Answer in One Minute
If your estate lives mainly on AWS, start with CloudWatch. It already receives many AWS service metrics, integrates with CloudWatch Logs, and can trigger alarms without routing all infrastructure telemetry through a separate vendor. For modest deployments with disciplined retention and sampling, it can be a rational default. That does not mean every CloudWatch metric is free or that every log query is cheap. The bill depends on how you instrument your workload and what you retain.
A multicloud operations team may benefit from Datadog’s broader integration surface. A development team struggling to assign and reproduce exceptions may get more immediate value from Sentry. Choose around the incident each team needs to solve, not the number of features in a comparison chart. These products overlap, but their purposes are not identical. An organization can reasonably use CloudWatch for infrastructure, Sentry for application errors and a separate incident-management system without buying a full duplicate stack.
Research limitation: this is a documentation-based review. We did not test a live customer AWS account or measure ingestion speed, uptime, search latency or alert delivery. Use the seven-day pilot below to evaluate those outcomes before purchasing.
⚡ Is Amazon CloudWatch Worth It in 2026?
CloudWatch is worth considering because AWS-native visibility lowers the number of integrations you need before you can watch a resource. An EC2 instance, an ECS service and a Lambda function can participate in a shared monitoring workflow even if the detailed metrics they emit differ. An engineer can start with resource health, pivot into CloudWatch Logs, inspect an alarm and escalate to a trace when the instrumentation supports it. That is a compelling baseline for organizations already spending most of their infrastructure budget inside AWS.
EC2 CPU metrics cannot identify which checkout step failed. One custom metric split by many labels becomes many billable series. And a CloudWatch bill is a collection of usage charges, not one flat team subscription. For example, custom metrics can be charged per series while logs are billed by ingestion, retention and query usage; application tracing has its own metering rules.
👍 What We Like
- Native AWS resource context reduces initial monitoring integration work for teams already on the platform.
- CloudWatch Logs Insights gives engineers a queryable route from symptoms to events, not just a static log file.
- Alarms, composite alarms and anomaly detection can turn observations into operational decisions, with explicit alert-state behavior.
- OpenTelemetry support makes metrics, logs and traces easier to collect using open-source instrumentation.
- Cross-account observability can help a designated monitoring account inspect supported telemetry from linked AWS accounts; verify Region, permission and trace-copy behavior before relying on it.
⚠️ Limitations to Know
- CloudWatch pricing is not summarized by a single monthly number; a bill can contain numerous consumption dimensions.
- High-volume debug logging, unbounded retention, unnecessary metric dimensions and costly queries can all accumulate unexpectedly.
- A large hybrid or multicloud estate may prefer the presentation and integration model of a third-party observability suite.
- A trace requires instrumentation and permissions; merely enabling a console view will not reveal code-level causality.
- Some features, Regions, log classes and data sources carry different limits; verify the exact implementation rather than assuming universal parity.
🧠 What Is Amazon CloudWatch?
Amazon CloudWatch is AWS’s monitoring and observability service family. It collects operational signals and presents metrics, log data, alarms, dashboards and tracing-related investigations. The official CloudWatch overview describes monitoring AWS resources and applications in real time, but what you see depends on which telemetry source and supporting feature you have enabled.
For a small team, think of three questions: How much? What failed? Why? Metrics answer the first question with numbers over time: request count, duration, error rate, CPU or queue depth. Logs answer the second with individual application or service events. Traces help with the third by showing how a request crosses components. CloudWatch can support all three, but you must decide which signals deserve collection, retention, alerts and a budget.
A typical AWS CloudWatch monitoring deployment begins by choosing a critical service rather than connecting every available integration. Start with its service-level indicators: request latency, failed requests and availability. Then add the logs that explain those failures, the CloudWatch alarm that points to an owner, and trace data for representative slow or failing operations. That sequence is more defensible than turning on every enhanced feature and investigating cost after the fact.
AWS infrastructure monitoring is not application monitoring
CloudWatch already sees many AWS resource metrics, but a low-CPU server can still fail a payment workflow because of a downstream dependency, expiring credential or application exception. Application Signals, service maps, tracing and well-designed custom metrics narrow that visibility gap, while CloudWatch Logs supplies detailed evidence. Engineers should write down the operational question each new telemetry feed must answer before enabling it.
Infrastructure visibility also varies by resource. EC2, ECS, EKS, RDS, Lambda and API Gateway have different metric namespaces and integration paths. CloudWatch agent configuration can add host-level or application telemetry, yet the extra data may create new chargeable metrics or log volumes. Do not assume that adding an agent is cost-neutral simply because the console has a free entry point.
📈 AWS CloudWatch Monitoring: Metrics, Dashboards and Alarms
📊 Metrics and High-Cardinality Dimensions
Classic CloudWatch metrics represent a named measurement plus dimensions. That structure makes it possible to break down performance by service, endpoint or environment; it also makes metric counts worth reviewing. A metric with dimensions such as region, service, deployment and tenant can multiply into many separately chargeable time series. Limiting labels to operationally useful values is a cost-control practice, not an excuse to remove the details needed for debugging.
Many AWS service metrics arrive automatically, subject to their respective service configuration. Custom metrics and detailed monitoring can introduce additional charges. Engineers should inventory metrics by namespace, resolution and cardinality rather than budgeting on the number of charts shown on a dashboard. The AWS feature overview documents dashboards, metric math and high-resolution alarming, but which features you enable should be tied to a specific incident workflow.
🖥️ Dashboards: Useful, Not Proof of Reliability
An Amazon CloudWatch dashboard can combine metrics, graphs and operational context, including views spanning multiple accounts where configured. Its value is highest when the graphs tell an on-call person what to do. A useful service dashboard might show the error rate, request latency, traffic volume, queue backlog, affected dependency and recent deployment events. A dashboard filled only with CPU graphs may be attractive while missing customer-impacting failures entirely.
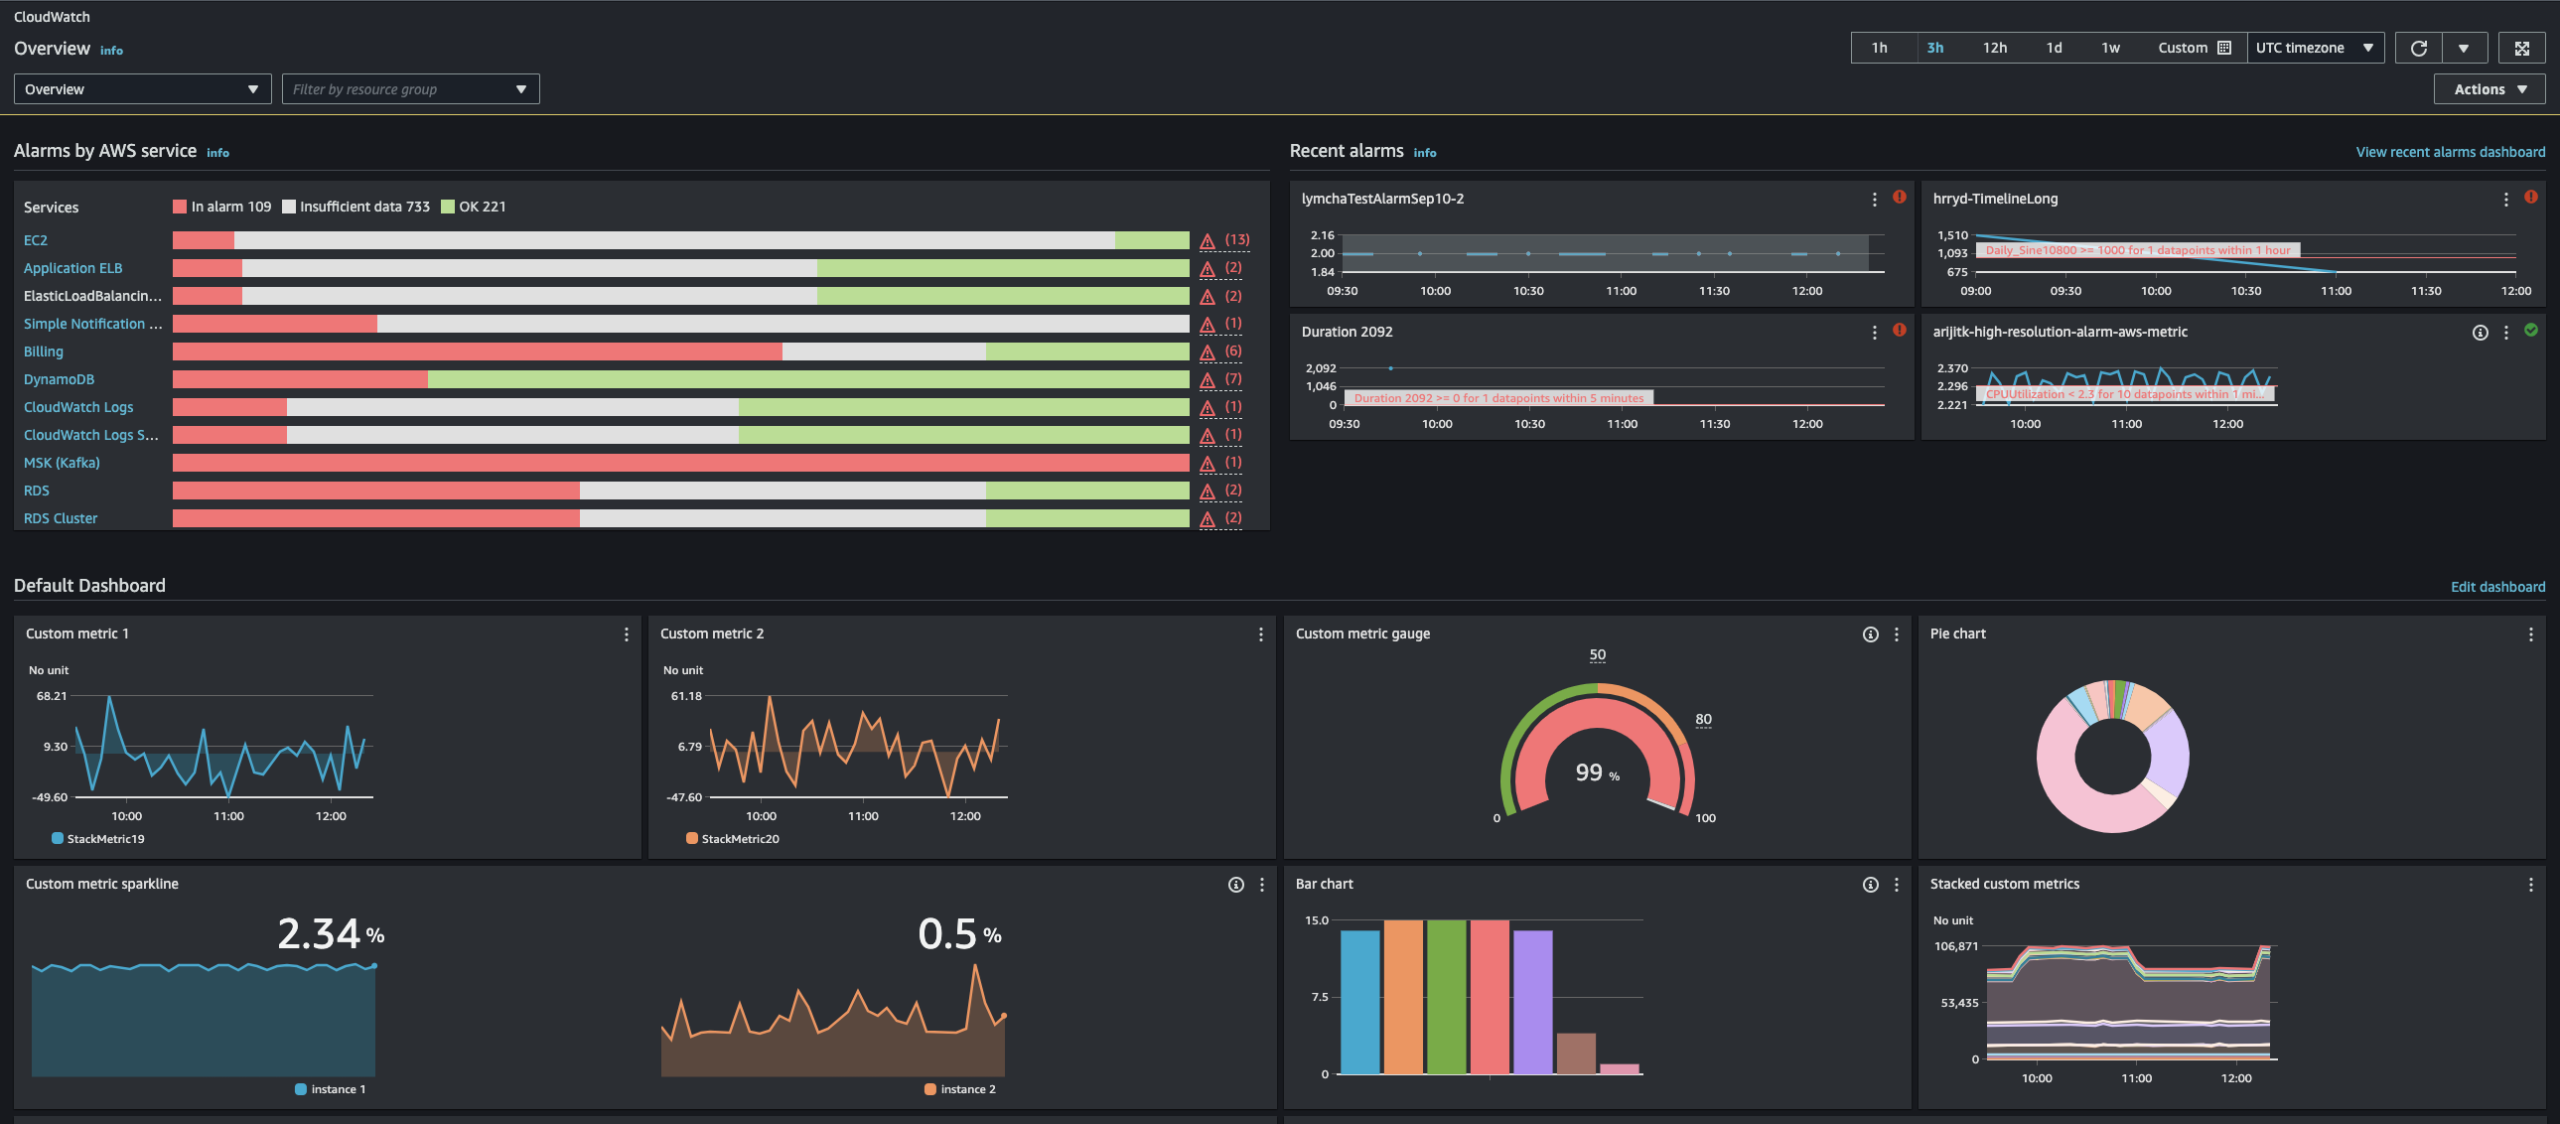
Assign each production dashboard to one on-call owner. Label milliseconds, seconds and percentages explicitly; remove widgets for decommissioned services. Be careful when comparing time periods with differing sample windows; a one-minute spike may vanish in a long aggregation interval. Never interpret a smooth trend as evidence that no individual customer saw an error.
🚨 CloudWatch Alarms and Anomaly Detection
CloudWatch alarms watch a metric or eligible expression and transition among states such as OK, ALARM and INSUFFICIENT_DATA. That last state is essential: absence of data should not automatically be reported as a healthy system. Actions are generally triggered by state transitions, not a continuous email every minute. Composite alarms combine conditions to reduce noise when several underlying signals describe one outage. The AWS alarm documentation explains the behavior and available actions.
Anomaly detection uses statistical models to estimate expected ranges. It can improve a baseline for seasonal traffic, but should not replace a clear service-level objective. An abnormal request count is not automatically an incident, while a small percentage of failed payments may be significant even when all other metrics look normal. A mature alarm has a threshold, a short explanation of impact, a named owner, an escalation route and a runbook.
When AWS-native metrics are enough
CloudWatch can be sufficient when a service is small, the AWS monitoring story is coherent and the team has a predictable operational rhythm. It becomes less convincing when nobody owns a dashboard, every alert goes to the same inbox, or the team cannot correlate a metric spike with the offending request. At that point the necessary investment may be better instrumentation and process rather than another vendor subscription. Our Amazon CloudWatch review treats alert quality as an engineering outcome, not a purchased feature.
📋 CloudWatch Logs: Search, Retention and Security
CloudWatch Logs Pricing and Logs Insights: Investigation Costs
When an alarm fires, an engineer needs evidence, not a wall of unfiltered text. CloudWatch Logs Insights allows querying log groups to filter, aggregate and investigate events. A good starting question is precise: which requests returned 5xx status for a specific service after the latest deployment? The answer may need a request identifier, service name, region and trace correlation field. Without consistent structured logging, an apparently powerful query system still produces frustrating incident response.
The operating model matters as much as query syntax. Logs Insights queries can introduce scanned-data charges depending on the log class and relevant pricing schedule. Running broad queries against huge log groups to find one incident wastes time and money. Use time bounds, relevant log groups and structured attributes. Separate development debug logs from production audit events, and avoid publishing secrets, authentication tokens or raw personal data into either stream.
Standard vs lower-cost log classes
CloudWatch Logs has a full-featured Standard class and a lower-cost Essentials class (formerly called Infrequent Access) for less frequently accessed data. AWS has confirmed this is a naming change rather than a pricing or functional change. The official log-class comparison is the reference to consult before creating a log group. The lower-cost class does not provide every Standard capability. Treat that as a feature decision, not simply a discounted storage toggle. The CloudWatch Logs documentation and log-class concepts should be checked at the moment a log group is created.
Retention is another foundational decision. Different log groups should have different lifetimes: an application debug stream may only need a short window, while certain security and audit records may require longer retention for business reasons. Longer retention increases stored volume, but retaining everything by default does not guarantee better investigations. Define the purpose of each log stream and record the retention period, access permissions and deletion expectations.
CloudWatch Logs Standard vs Essentials: feature comparison
CloudWatch Logs Essentials offers a lower ingestion price than Standard, while AWS charges the same for storage and Logs Insights in either class. Both offer managed ingestion, storage and KMS encryption. Essentials supports most Logs Insights QL commands, but not every command or Standard-only features such as Live Tail and metric filters. A log group’s class cannot be changed after creation. Source: AWS CloudWatch Logs log classes.
| Operational requirement | Standard log class | Essentials (formerly Infrequent Access) | Buyer takeaway |
|---|---|---|---|
| Log ingestion and storage | Supported | Supported, with lower ingestion price | Compare the complete monthly volume |
| Logs Insights querying | Fuller supported command set | Most commands supported | Validate your specific saved queries |
| Live Tail | Supported | Not supported | Choose Standard for interactive live debugging |
| Metric filters and field indexing | Supported | Not supported | Do not assume equal monitoring workflows |
| Data protection masking | Supported | Supported | Test access and redaction separately |
| Best operational fit | Frequently inspected operational logs | Occasional historical investigation | Pick class before log-group creation |
Log data protection is an ongoing operational task
CloudWatch can help discover or mask sensitive data in logs when configured with applicable data-protection functionality. That does not justify logging sensitive content indiscriminately. Redact secrets and personal identifiers at the source, restrict who can query production logs, and test whether your app sends tokens or account fields in error messages. Consider encryption and key-management requirements in each AWS Region. Monitoring should never quietly become a second customer database.
When comparing CloudWatch Logs pricing with an outside platform, map the same signal to the same retention and access requirement. One vendor may price ingest and indexed search separately; another may price storage, reads and analytics in different units. A cheap per-GB ingest quote alone is not a trustworthy full-month comparison.
🧩 CloudWatch OpenTelemetry, Application Signals and Distributed Tracing
Metrics, logs and traces in one observability workflow
OpenTelemetry is an open-source instrumentation and collection framework, not a monitoring vendor subscription. CloudWatch supports the OpenTelemetry Protocol for metrics, logs and traces, with AWS documentation describing PromQL queries for OTel metrics, Logs Insights for logs and Transaction Search for traces. That matters because teams can use widely adopted collectors and SDKs while retaining meaningful operational context. It does not eliminate the need to monitor collector health, sampling rules or metadata volume. See the official OpenTelemetry integration guide.
Name one service consistently across the SDK, collector and dashboard. Include a request ID where appropriate, retain error traces at a defined rate, and document how normal traffic is sampled. A high-traffic service can produce large trace volumes even with reasonable per-request data sizes. It is misleading to compare the costs of a 1% sampled trace stream with another vendor storing 100% of the same traffic.
Application Signals and service-level objectives
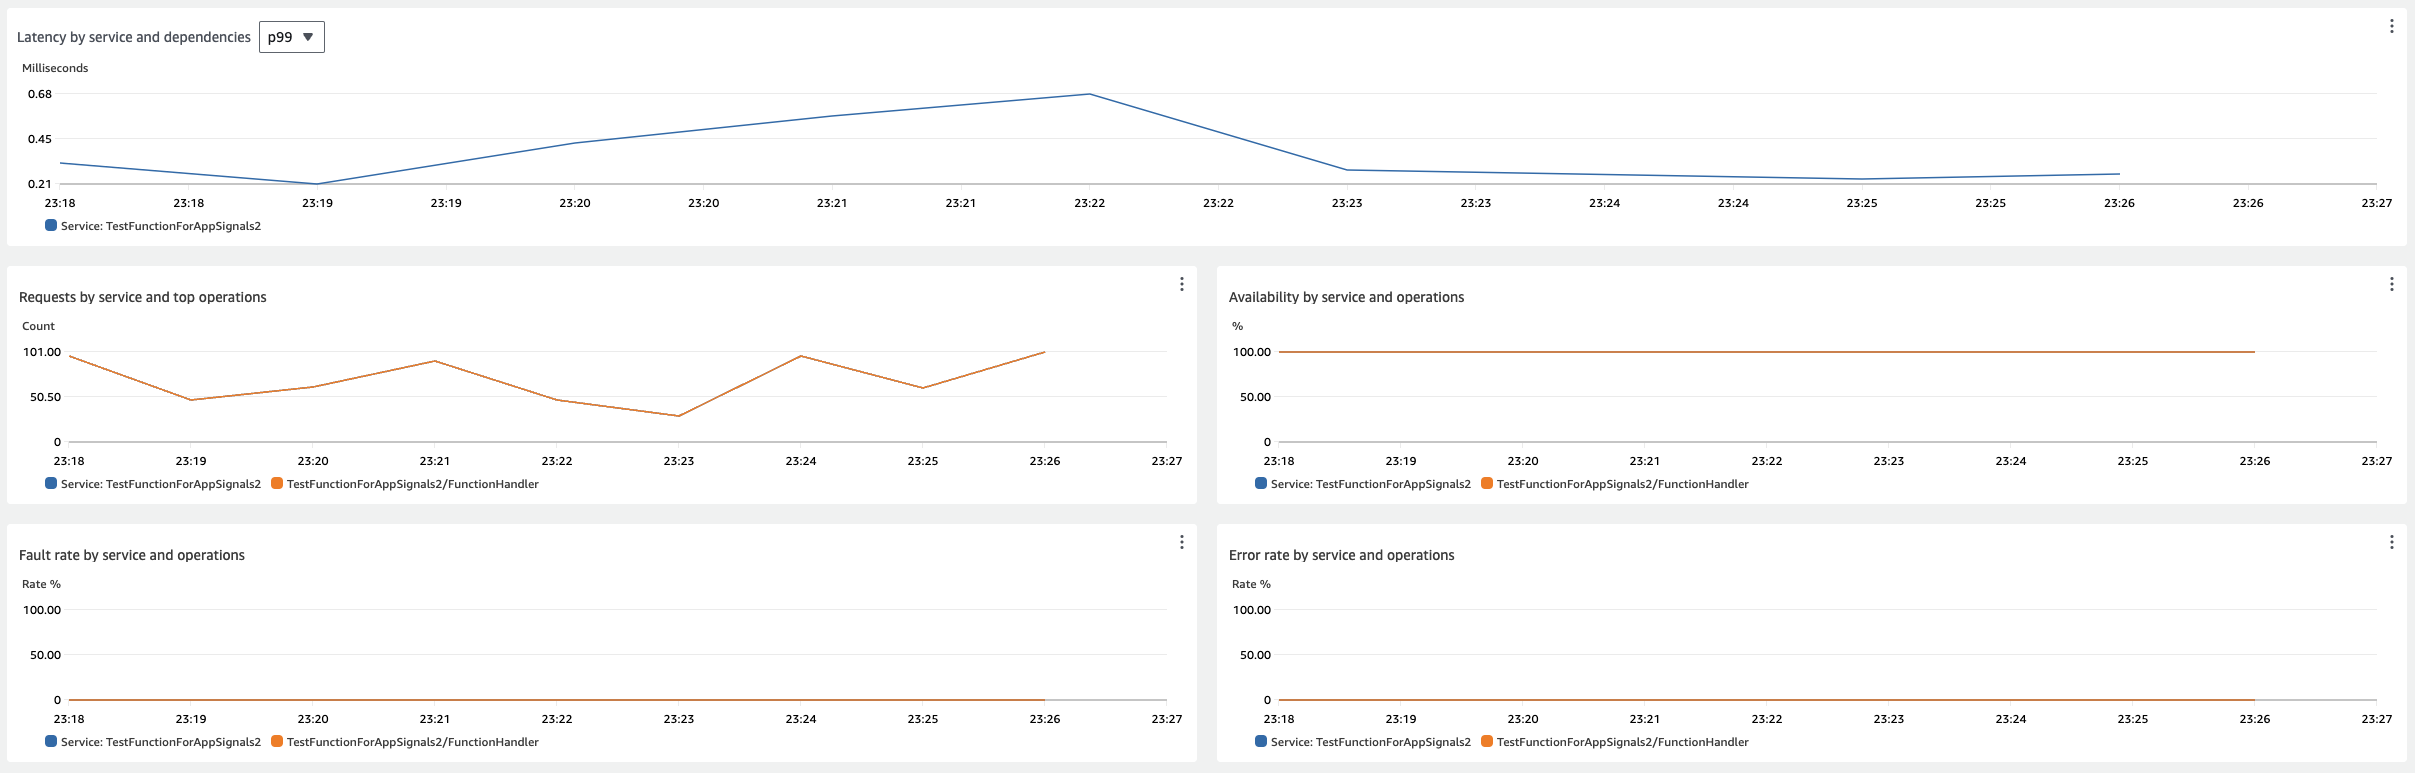
CloudWatch Application Signals brings application latency, error measures, trace correlation and service-level objectives into the Application Map workflow. AWS says the Application Map replaces the older Service Map; the X-Ray Trace Map remains a separate view. See the AWS Application Map documentation. SLOs translate the operational discussion from “the graph looks different” to a promised user-experience target over time. An SLO such as successful checkout percentage is more actionable than an unqualified dashboard rating. AWS describes Application Signals coverage and instrumentation methods in its APM guide.
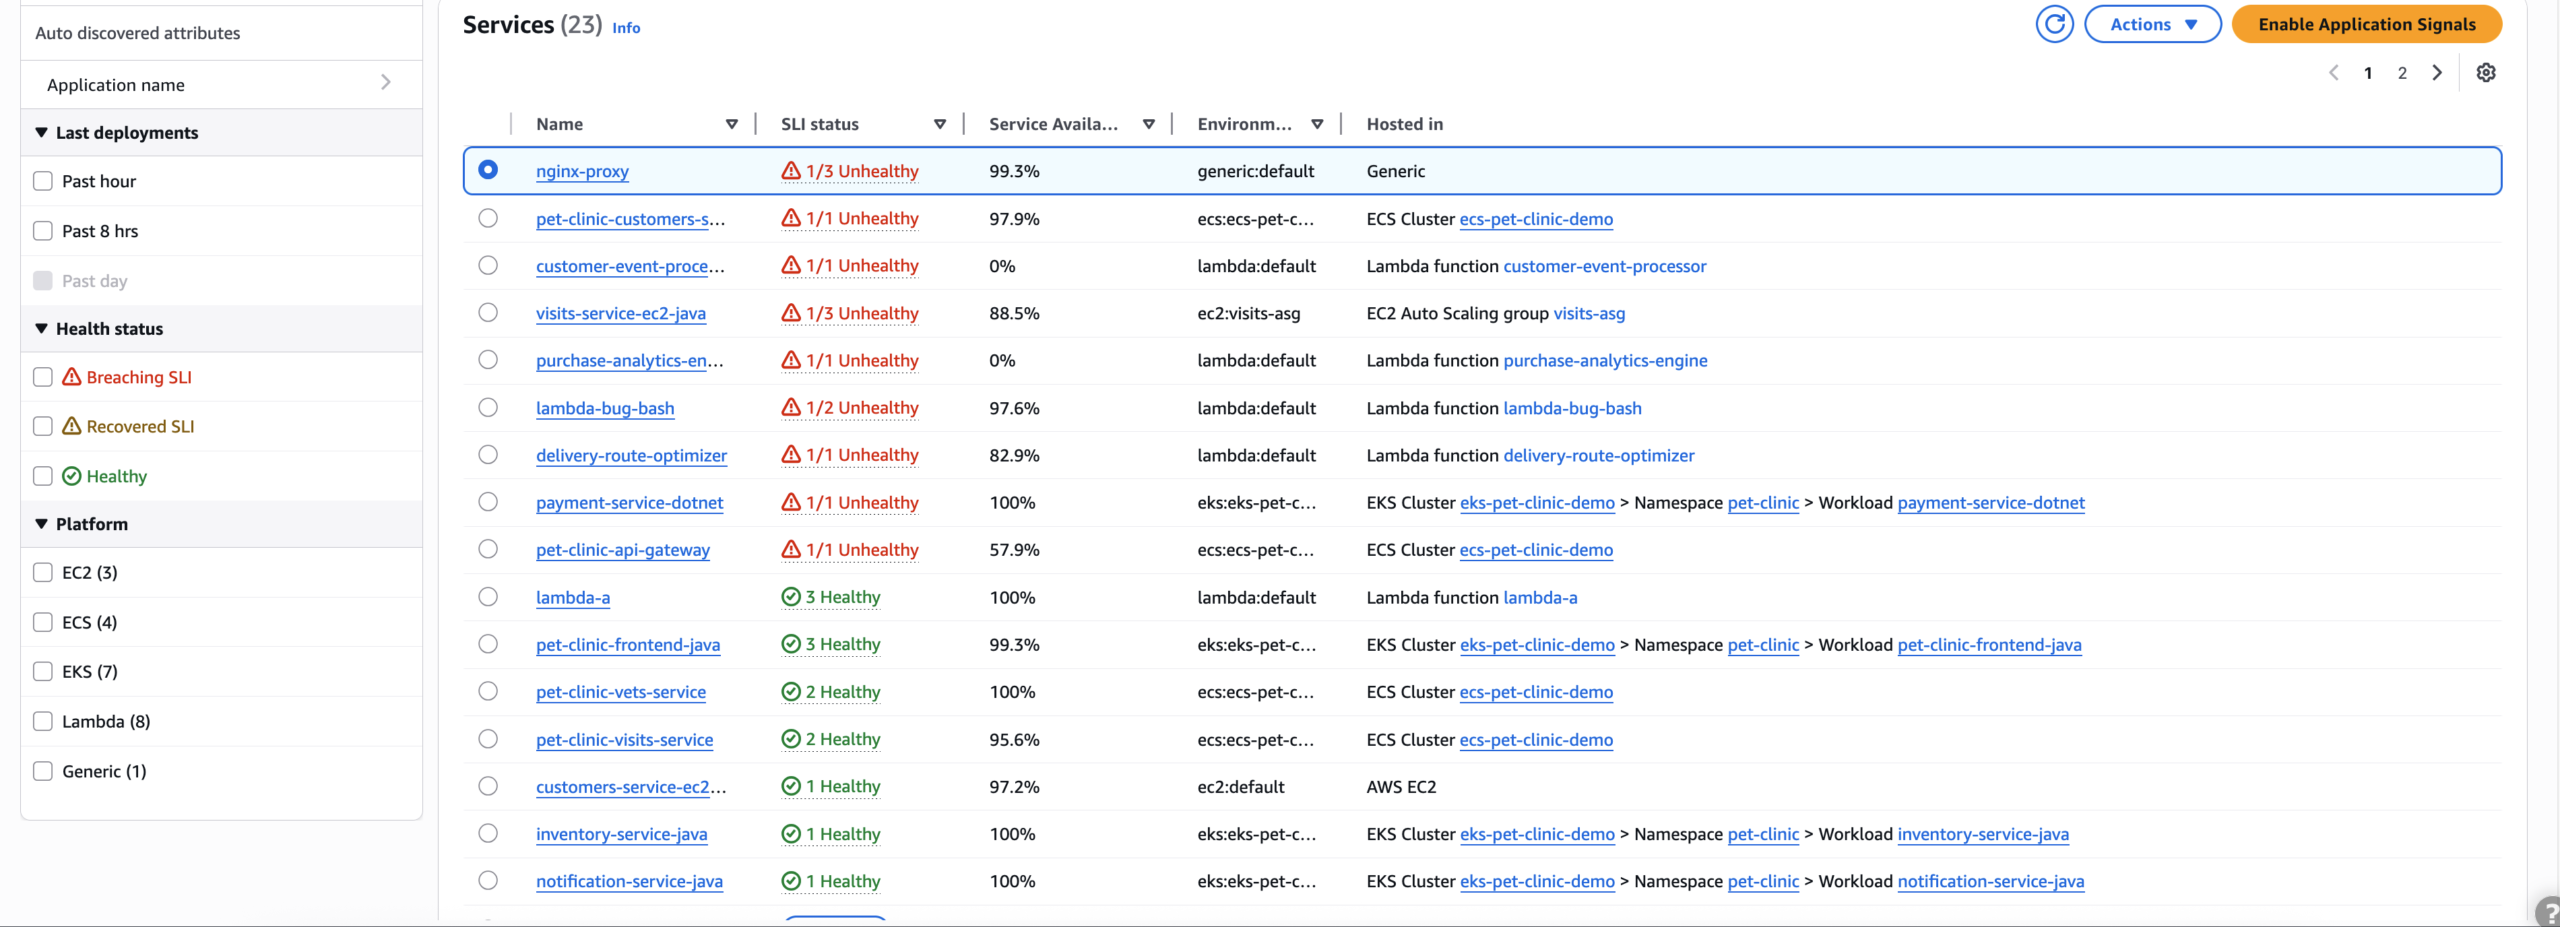
Some capabilities require Transaction Search or specific instrumentation paths. Existing X-Ray SDK implementations, ADOT and open-source OpenTelemetry integrations do not necessarily have identical out-of-the-box features. A team should pilot one language, one service and one deployment route before assuming the same setup will work across all workloads. This is especially important for a mixed stack that combines Lambda, container services and applications running outside AWS.
November 2026: OTLP trace API keys
The November 3, 2026 AWS announcement added bearer-token API keys as an authentication option for the AWS X-Ray OTLP traces endpoint. A compatible OTLP/HTTP exporter can set an Authorization header instead of signing every request with AWS Signature Version 4. This can simplify integration for tools or workloads that do not support SigV4. It is not a blanket replacement for IAM-based security and it does not automatically enable all exporters in every Region. AWS still recommends SigV4 and says the ADOT SDKs continue using it by default.
Verified product update (November 2026): AWS confirmed on November 3, 2026 that bearer-token authentication for OpenTelemetry traces is available in commercial Regions where the X-Ray OTLP traces endpoint exists. This option is useful when an exporter cannot sign SigV4 requests; AWS still recommends SigV4, and AWS Distro for OpenTelemetry SDKs continue using it by default. Check token storage and the regional endpoint before enabling an exporter. Official GitHub announcement; read DigiOffly’s full news coverage.
For an OTLP exporter using API keys, document where its credential lives, who rotates it, which endpoint it can access and how a failed export is detected. Metrics and traces have distinct OTLP endpoints and service-specific API keys. For example, US West (Oregon) metrics use https://monitoring.us-west-2.amazonaws.com/v1/metrics, while traces go to the AWS X-Ray OTLP endpoint at https://xray.us-west-2.amazonaws.com/v1/traces. Bearer tokens for one service are not interchangeable with the other; use SigV4 with temporary credentials where feasible. See the official OTLP endpoint reference. Static credentials can be operationally convenient and dangerous if copied into source repositories or CI logs. The AWS release note specifies the region availability and the supported trace-ingestion endpoint. Our DigiOffly coverage of CloudWatch API keys gives a focused explanation of what changed, including why the security choices matter.
💰 AWS CloudWatch Pricing 2026: What You Actually Pay For
AWS CloudWatch pricing is metered: each telemetry feed or monitoring feature can add a different line item. A per-seat estimate would omit the main consumption-based charges. CloudWatch pricing can include classic custom metrics, standard and high-resolution alarms, logs ingested and stored, Logs Insights scans, dashboards, API calls beyond applicable allowances, traces, Application Signals and specialist features such as synthetic canaries. Not every feature applies to every workload, and the AWS pricing page explains additional regional differences.
💸 Amazon CloudWatch Free Tier and Its Limits
AWS publishes free-tier allowances, including an example that subtracts 5 GB of CloudWatch log ingestion per month before applying charges. That is a useful starting point for a tiny deployment, but it is not proof that production monitoring stays free forever. Separate rules apply to metrics, queries, alarms and optional features. Also, new AWS accounts may qualify for promotional credits that should never be confused with the recurring standard pricing model.
Ask whether the quote assumes remaining free allowances, whether it uses US East rates or the actual AWS Regions in your workload, and whether another AWS service adds supporting charges. The correct CloudWatch free-tier comparison is not “free versus paid” but “which telemetry do we need, what is included, and what happens after the threshold?”
Classic CloudWatch metrics vs OpenTelemetry metrics
AWS’s published examples include classic custom metric pricing at approximately $0.30 per metric per month for the first tier in US East, before volume discounts. A standard-resolution metric alarm is commonly illustrated at $0.10 per monitored metric per month, with different rules for high-resolution and anomaly alarms. These are example rates, not a universal quotation. A small change in how dimensions are emitted can turn a handful of metrics into many separately billable series.
Newer CloudWatch OpenTelemetry metrics can instead use a GB-ingestion model. AWS lists $0.50/GB for OTel metrics in its CloudWatch Omni pricing overview. The corresponding documentation says the OTel approach does not bill per metric or metric-query API call in the same way as classic custom metric billing, but bytes and label richness still matter. Teams should verify which path their collectors actually use before applying one calculator to the other.
AWS CloudWatch Classic vs OpenTelemetry metrics: comparison
The two metric-ingestion approaches use different metering units. The table below is grounded in AWS’s OpenTelemetry metric pricing and storage guide and is more useful than multiplying one sample price by every possible metric.
| Comparison point | Classic CloudWatch Metrics | OpenTelemetry Metrics | Practical buying implication |
|---|---|---|---|
| Primary billing unit | Unique metric series per month | GB of OTLP metric payload ingested | Model series count versus actual bytes |
| Query approach | Metric APIs and Metrics Insights | PromQL, including console and API | Choose for your team’s query workflow |
| Cardinality impact | Unique dimension combinations create billable series | Extra labels raise payload size | Avoid labels without operational value |
| Metric retention | Standard published CloudWatch retention policy | 15 months included in current OTel model | Confirm sample granularity for your queries |
| Programmatic query billing | GetMetricData metrics requested | PromQL samples scanned | Include query automation in cost models |
| Better initial fit | Existing AWS-native and legacy integrations | New OTel-instrumented workloads | Pilot the actual collector path |
Logs, traces and advanced monitoring charges
An AWS pricing example uses $0.50 per ingested GB for Standard application logs in US East and subtracts 5 GB under its illustrated free allowance. The lower-cost class may carry a smaller ingest price but has feature trade-offs. AWS’s CloudWatch Omni price page lists $0.35–$0.15 per GB tiers for spans, depending on volume, alongside the separate ingest price for logs and OTel metrics. These are not automatically interchangeable with every older X-Ray trace-based billing scenario. In particular, never mix a per-trace example with a per-GB span example without verifying the specific ingestion model.
For CloudWatch Logs pricing, a defensible estimate also includes storage retention, expected query scan volume and any data protection or delivery features. For traces, start with traffic, average spans per request, average span size and sampling rate. For synthetic monitoring, add canary execution and the costs of supporting AWS resources where applicable.
🧮 A Transparent Cost Example (Not a Quote)
Imagine a service that ingests 30 GB of Standard application logs in one month, with the example’s 5 GB free ingestion allowance unused elsewhere. At the cited $0.50/GB example rate, the ingest portion would be (30 − 5) × $0.50 = $12.50. Add 40 classic custom metrics at an illustrative $0.30 each for $12. Add 10 standard-resolution metric alarms at a sample $0.10 each for $1. The subtotal would be $25.50, before log storage, query scans, traces, dashboards and any feature-specific fees.
This $25.50 subtotal illustrates the calculation only; it excludes storage, queries, tracing and Region-specific charges. Confirm any remaining free allowance in your own account. OTel metric ingestion uses different units. For an actual buying decision, put your Region, month length, retention and observed traffic into the AWS pricing calculator, then compare the result with Cost Explorer after a pilot.
Four CloudWatch cost guardrails that work in practice
- Inventory each data stream. Record log source, daily GB, metric namespace and dimensions, expected span traffic, owner and retention.
- Cap noise at the source. Remove needless debug events, avoid high-cardinality labels where they do not add operational value and sample traces against a defined objective.
- Alert on cost as well as failures. Use AWS budgets and billing analysis to catch unexpectedly growing CloudWatch usage. The CloudWatch cost analysis guide describes resource and operation-level investigation.
- Reconcile actual usage weekly. Compare the forecast with what AWS says you consumed, not just the amount you set aside for a monitoring product.
In this Amazon CloudWatch review, the strongest financial recommendation is to create a cost spreadsheet with units before running the pilot. A dashboard cannot tell you whether the associated metric series, log storage and query workload are economically appropriate.
⚖️ Amazon CloudWatch vs Datadog vs Sentry
These platforms should not be ranked by counting adjacent product names. CloudWatch is particularly relevant when AWS service telemetry is the operational starting point. Datadog is a broader third-party observability platform with separate infrastructure, APM, log and other product families. Sentry concentrates on issues developers need to diagnose and resolve, including error grouping and performance context. All three can support tracing, but the route from a production problem to a responsible engineer differs.
| Buying question | Amazon CloudWatch | Datadog | Sentry |
|---|---|---|---|
| Primary entry point | AWS resources and application telemetry | Broad infrastructure and SaaS observability | Developer errors and application performance |
| Natural strength | Native AWS monitoring and alarms | Unified operations across mixed technology | Actionable exception and release-level diagnosis |
| Major budgeting challenge | Logs, metrics, queries, spans and optional features | Multiple host, log, APM and add-on units | Event volumes, performance, replay and plan limits |
| Where to begin a pilot | One critical AWS service plus logs and alarms | One representative service across systems | One application with reproducible errors |
| Typical reason to choose it | AWS-native workflow | Cross-vendor operational overview | Developer triage and ownership |
| Limitation to validate | Cross-system navigation and cost predictability | Total cost when modules are combined | Coverage for infrastructure-wide operations |
⚖️ CloudWatch vs Datadog: Native Context or One Broader Pane?
For teams operating across clouds, the question is which telemetry belongs with AWS infrastructure and which incidents need one vendor-neutral view. With CloudWatch, teams may obtain the first viable production alarms quickly because resource metrics already exist. That advantage weakens if engineers must switch among several consoles to reconstruct one incident. Datadog can make cross-platform correlation appealing, but billing can grow as infrastructure, APM and log products are adopted together. Review the official Datadog pricing alongside our Datadog review 2026 rather than assuming a published starting host price covers all telemetry.
For a fair pilot, select the same three user-impacting failure scenarios and measure how much work each platform requires to identify the faulty dependency. Track operator minutes, alert noise, setup maintenance, coverage gaps and the resulting one-month bill. Price comparison without equal telemetry coverage will be misleading.
🛠️ CloudWatch vs Sentry: Alarms or Developer Issues?
The Sentry decision is narrower: do developers need an issue queue for reproducing exceptions, or is AWS resource observability already enough? Sentry can be useful for errors and release regressions that need a developer’s attention. Keep CloudWatch as the infrastructure alarm source and Sentry as the developer issue queue when that division fits your workflow. Configure one escalation owner to prevent duplicate notifications. Our Sentry review 2026 examines issue grouping, tracing and consumption considerations.
The overlap becomes wasteful when two platforms generate independent alerts for the same event with no common escalation policy. Decide who owns the incident, which tool holds the primary evidence and which event should create the human notification. That process decision often matters more than an additional integration checkbox.
🧪 How to Evaluate CloudWatch Without Wasting a Month
🧪 An Honest Seven-Day Pilot Plan
- Day 1: Choose an AWS service and three realistic failure scenarios using non-sensitive test data.
- Day 2: Record baseline traffic, error rate and latency.
- Day 3: Add structured logs with retention limits, and verify request-to-log correlation.
- Day 4: Connect tracing, document sampling and test collector permissions.
- Day 5: Configure two alarms; test missing-data and escalation behavior.
- Day 6: Rehearse a failure and time the route from alert to the responsible engineer.
- Day 7: Compare estimated and actual cost in AWS Cost Explorer.
Before testing, agree on a target for investigation time and the maximum number of tools an engineer should need to open. Record the actual evidence in a worksheet: minutes from alert to identified dependency, missing log fields, alarms triggered per test, successful trace lookups at the chosen sample rate, and ingested GB per day. Compare the estimated bill against Cost Explorer before expanding coverage. Those answers reveal whether AWS CloudWatch monitoring fits the team.
🔐 Security and Governance Checklist
CloudWatch access commonly sits inside an AWS identity and account structure, so access design deserves attention before deployment. Apply least privilege to logs, dashboards, alarm changes and tracing endpoints. Decide which identities may export data, who can create new log groups, and which production engineers can view potentially sensitive records. Confirm regional storage obligations and retention policy. Test credential rotation for every collector using a token, especially the new X-Ray OTLP bearer-token path.
When multiple accounts contribute signals, document the monitoring account boundary and the permissions required to link sources. AWS cross-account observability documentation explains how these relationships work. Centralized visibility should not silently turn into unlimited data access for every developer.
🔎 What We Did—and Did Not—Test
This Amazon CloudWatch review was researched against current public AWS technical documentation, published AWS prices and DigiOffly’s related published articles, plus the official competitor pricing information. We did not connect an AWS customer account, send live telemetry, run high-volume load tests, measure CloudWatch API performance, or verify a customer’s real invoice. The hypothetical example above is arithmetic based on explicitly stated AWS example units. It should not be interpreted as a hands-on benchmark or a measured deployment outcome.
🏆 Final Verdict: Who Should Buy Amazon CloudWatch?
If most critical services run on AWS, begin the evaluation with CloudWatch. Its native resource metrics, logs, alarms and tracing-related investigations may cover the first response to an incident before you purchase a second observability service. For a small AWS service with carefully selected signals, that may be enough. For an intricate multicloud system, developer-facing issue workflow or organization with many disconnected observability tools, CloudWatch alone may not be the right answer.
Our conclusion is not that CloudWatch is universally cheap or that third-party platforms are automatically superior. The question is what your engineers can investigate at an acceptable recurring telemetry cost. Start with one representative failure scenario, monitor the cost line items and decide whether the alerting and debugging workflow makes the team more effective. That is a much stronger purchasing signal than an unverified five-star rating.
Read the official Amazon CloudWatch documentation and its pricing page before you activate a new billable feature. For an explanation of the November tracing authentication update, see DigiOffly’s Amazon CloudWatch API-keys news report. If you’re comparing approaches across products, continue to our Datadog and Sentry reviews linked above.

Frequently Asked Questions
What is Amazon CloudWatch used for?
Amazon CloudWatch monitors AWS resources and applications through metrics, logs, alarms, dashboards and tracing-related tools. It helps operations teams identify unhealthy services, investigate individual events and understand dependencies. The exact features depend on the AWS service, instrumentation and CloudWatch components enabled.
Is Amazon CloudWatch free?
CloudWatch has published monthly free-tier allowances for some services, but it is not unlimited free monitoring. Logs, custom metrics, alarm evaluations, query scans, tracing and other services may be chargeable beyond allowances. New-account promotional credits are separate from the recurring free-tier rules.
How much does Amazon CloudWatch cost in 2026?
There is no universal monthly price. AWS bills multiple usage units. For example, an official US East illustration uses $0.50 per ingested GB of Standard application logs after a 5 GB example free allowance. Classic custom metrics and alarms have their own charges, while newer OpenTelemetry metrics can be billed per GB. Check Region-specific official pricing.
What is the difference between CloudWatch Logs and Logs Insights?
CloudWatch Logs receives, stores and organizes log events into groups and streams. Logs Insights is the query and investigation experience used to filter, aggregate and examine those events. Log ingestion, storage and query scanning can have different price components, so an estimate should include all three.
Can CloudWatch monitor resources outside AWS?
Yes, with appropriate agents, OpenTelemetry collectors, hybrid integrations and supported external data sources. Feature parity and setup effort differ from native AWS services. For cross-account AWS visibility, configure monitoring-account and source-account IAM permissions, limit shared log groups to what operators need, and validate the applicable Region scope before rolling out widely.
Does Amazon CloudWatch support OpenTelemetry?
Yes. AWS documents native OpenTelemetry Protocol paths for metrics, logs and traces. OTLP metrics can be queried with PromQL, logs with Logs Insights and traces with Transaction Search where configured. Collector configuration, billing models, supported Regions and authentication still need review.
What changed for CloudWatch traces in November 2026?
On November 3, AWS announced bearer-token API keys for the AWS X-Ray OTLP traces endpoint, so compatible OTLP/HTTP exporters can authenticate with an Authorization header. SigV4 remains recommended and ADOT retains SigV4 by default. The change does not eliminate credential-management obligations.
CloudWatch vs Datadog: which is better?
CloudWatch is a strong starting point for AWS-first teams because resource telemetry and alarms are natively integrated. Datadog may be more attractive for a diverse infrastructure estate needing broad cross-platform correlation. Compare identical incident scenarios and a full-month telemetry budget, not a single published starting price.
CloudWatch vs Sentry: which should developers choose?
Sentry focuses on application exceptions, regressions and developer issue workflows. CloudWatch covers broader AWS resource monitoring, logs and tracing. A team can use both when each has a clear owner and duplicate alerting is intentionally controlled.
Can CloudWatch alarms trigger automatic actions?
CloudWatch alarms can invoke configured actions and integrations when their state changes. Missing metrics can produce INSUFFICIENT_DATA rather than a healthy state. Engineers should test alarm behavior, permissions, escalation and runbooks on a real workload before production reliance.
How can I reduce AWS CloudWatch costs?
Inventory log ingestion and retention, limit unnecessary debug messages, manage metric dimension cardinality, set thoughtful trace sampling, scope Logs Insights queries and compare actual usage with AWS Cost Explorer. Avoid applying classic metric pricing to OpenTelemetry metric ingestion without checking which collection path is active.
EXPLORE NEXT ON DIGIOFFLY
🔍 Explore More on DigiOffly
This Amazon CloudWatch review works best alongside real operational examples, transparent comparisons and source-linked updates.
Explore related software
- Datadog review — Compare infrastructure, APM and log-cost units.
- Sentry review — Developer error tracking and release diagnostics.
- Development & DevOps hub — Browse related engineering tools.
Compare your shortlist
- Software Directory — Browse the published review catalog.
- Compare Software — Evaluate scope, platform fit and recurring costs.
- Software Finder — Narrow tools for your infrastructure workflow.
Plan costs and updates
- Software Cost Calculator — Budget for the parts you actually need.
- Latest CloudWatch news — November 2026 OTLP trace API-key change.
- DigiOffly Intelligence — Source-linked updates on software changes.