

Vendor information reviewed 2 November 2026. Plan details and known add-on charges are explained in the pricing section, with a direct link to the source. Current vendor pricing.
Editorial disclosure: This is a software and pricing research draft based on the linked vendor documentation, not a claim of a completed personal product benchmark or trading outcome. We do not provide investment, financial or tax advice.
TrendSpider is positioned around reducing the repetitive parts of technical-market research: drawing lines, screening symbols and monitoring conditions. That emphasis differs from a platform used mainly as a manual chart canvas. Whether automation saves meaningful work depends on having a rule that can be expressed precisely. A vague visual preference cannot be validated by running a larger scanner.
We distinguish the marketed feature set from tests that have actually been observed. Automated annotations, Raindrop Charts, Anchored Volume by Price and Sidekick AI can be evaluated using known instruments and fixed timestamps, but the results should not be invented from a feature list. For now the proposed checks are a reader's evaluation framework, backed by vendor documentation rather than performance measurements from our own account.
📊 TrendSpider Review Summary
Best-fit use: Charting & Technical Analysis. Pricing model: paid plans and potential additional data or usage charges. Check the full pricing breakdown below.
TrendSpider deserves paid consideration when the same technical rule has to be applied to a broad market universe every day. That use case values saved scans, alert logic and consistent market coverage more than decorative indicators. Users following only one or two symbols manually may find little reason to subscribe. Separate fees for specialist market feeds can change the economics materially.
⚡ Quick Verdict: Is TrendSpider Worth It?
The practical distinction for TrendSpider is between automated trendline detection and chart-analysis tools and what a user can validate from the selected plan. The decisive caveat is not every data feed is included in the base subscription. Compare that with TradingView before making an annual commitment.
The right competitor for an automated scanner depends on the inputs. Finviz can narrow US equities with fundamental filters, while TradingView supports a broad chart and scripting workflow. Comparing them by screenshot quality tells the buyer little. The stronger question is which tool can produce the intended shortlist using the same universe, session and definitions without hidden assumptions.
🧠 What Is TrendSpider?
TrendSpider is a platform in the Charting & Technical Analysis software category. Its relevant published capabilities include automated trendline detection and chart-analysis tools; market scans, configurable alerts and strategy testing; coverage of stocks, currency pairs and crypto, with optional derivatives feeds; sidekick ai assistant and add-on analytical capabilities. This makes it part of the broader trading-software stack, but it should not be confused with a guarantee of successful trades, a regulated investment recommendation or a substitute for evaluating market-data licensing.
A suitable TrendSpider buyer has a defined task: run a fixed scanner condition and inspect signals after bar close. A person needing coverage of stocks, currency pairs and crypto, with optional derivatives feeds may face a different licensing decision from someone who only reads weekly research. Name the instrument, expected export and budget before choosing a subscription tier. This avoids comparing products with different purposes as though their feature lists were directly interchangeable.
🖥️ Interface, Data and Day-to-Day Workflow
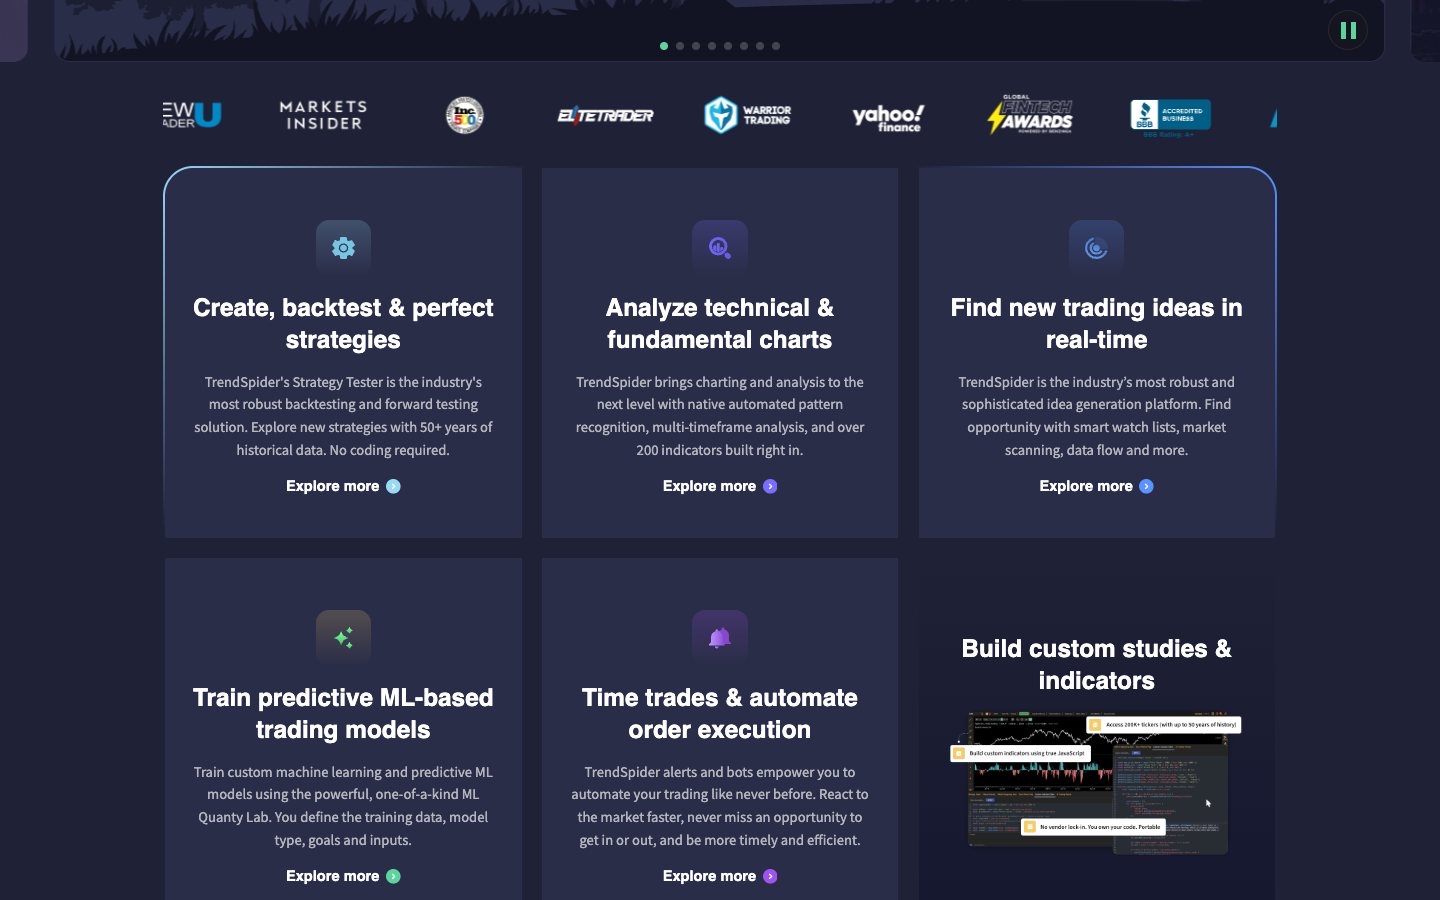
Follow the TrendSpider workflow from the input to the reported result. Start with check the data feed and update schedule for each target market; then record whether the output makes use of automated trendline detection and chart-analysis tools. If the data comes from another exchange, wallet or account, note that dependency explicitly. A screenshot can help explain the screen but does not independently verify the accuracy of every value it contains.
For TrendSpider, start with a constrained project: run a fixed scanner condition and inspect signals after bar close. Then check the data feed and update schedule for each target market. Treat that as a repeatable acceptance test, not as a trading system. If the result depends on a feed, exchange or report format that is absent from your plan, do not infer that the paid tier will fix it without verifying the entitlement.
🧭 How to Evaluate TrendSpider Before Subscribing
1. Define one scanning rule and confirm whether alerts match closed-bar results
Evaluation note: Before starting this check, record the chosen instrument and session zone. Inspect whether saved settings remain consistent when the platform is reopened. Any mismatch should be described with an exact timestamp rather than dismissed as user error.
2. Check the data feed and update schedule for each target market
Evaluation note: Run this check against a defined sample and record the limits of the account tier. If the feature is unavailable, note the subscription level rather than treating it as a software malfunction.
3. Compare backtest assumptions with spreadsheet or independent replay
Evaluation note: Keep a dated copy of the source input and the result. When external exchange or wallet data is involved, document that dependency so the same exercise can be attempted again.
4. Document the monthly subscription plus exchange and add-on fees
Evaluation note: Compare the output with a second method or a manually checked subset. Explain any disagreement before using the result in a recommendation; a successful screenshot alone does not establish data accuracy.
🛠️ Key Features and Real-World Fit
✓ Automated trendline and technical analysis workflows
automated trendline detection and chart-analysis tools: the practical question for TrendSpider is whether a user can run a fixed scanner condition and inspect signals after bar close. Compare the documented output with TradingView where appropriate, and check not every data feed is included in the base subscription before treating the feature as a subscription benefit.
✓ Market scans, configurable alerts and strategy testing
Market scans, configurable alerts and strategy testing: the practical question for TrendSpider is whether a user can check the data feed and update schedule for each target market. Compare the documented output with Finviz where appropriate, and check automated chart signals require interpretation and validation before treating the feature as a subscription benefit.
✓ Support for US equities, forex, crypto and optional futures/options feeds
coverage of stocks, currency pairs and crypto, with optional derivatives feeds: the practical question for TrendSpider is whether a user can compare backtest assumptions with spreadsheet or independent replay. Compare the documented output with FX Replay where appropriate, and check third-party strategies, deeper backtesting and ai usage may cost more before treating the feature as a subscription benefit.
✓ Sidekick AI assistant and add-on analytical capabilities
Sidekick AI assistant and add-on analytical capabilities: the practical question for TrendSpider is whether a user can document the monthly subscription plus exchange and add-on fees. Compare the documented output with TradingView where appropriate, and check not every data feed is included in the base subscription before treating the feature as a subscription benefit.
⚠️ Limitations and Accuracy Risks
- Not every data feed is included in the base subscription
- Automated chart signals require interpretation and validation
- Third-party strategies, deeper backtesting and AI usage may cost more
For TrendSpider, the warning about automated chart signals require interpretation and validation deserves a concrete example before publication. Check compare backtest assumptions with spreadsheet or independent replay. If this fails, identify whether the cause is a missing plan entitlement, incompatible input or out-of-date documentation. Do not substitute a generalized claim that all platforms are unreliable, because the specific limitation is what helps a buyer.
💰 TrendSpider Pricing and Total Ownership Cost
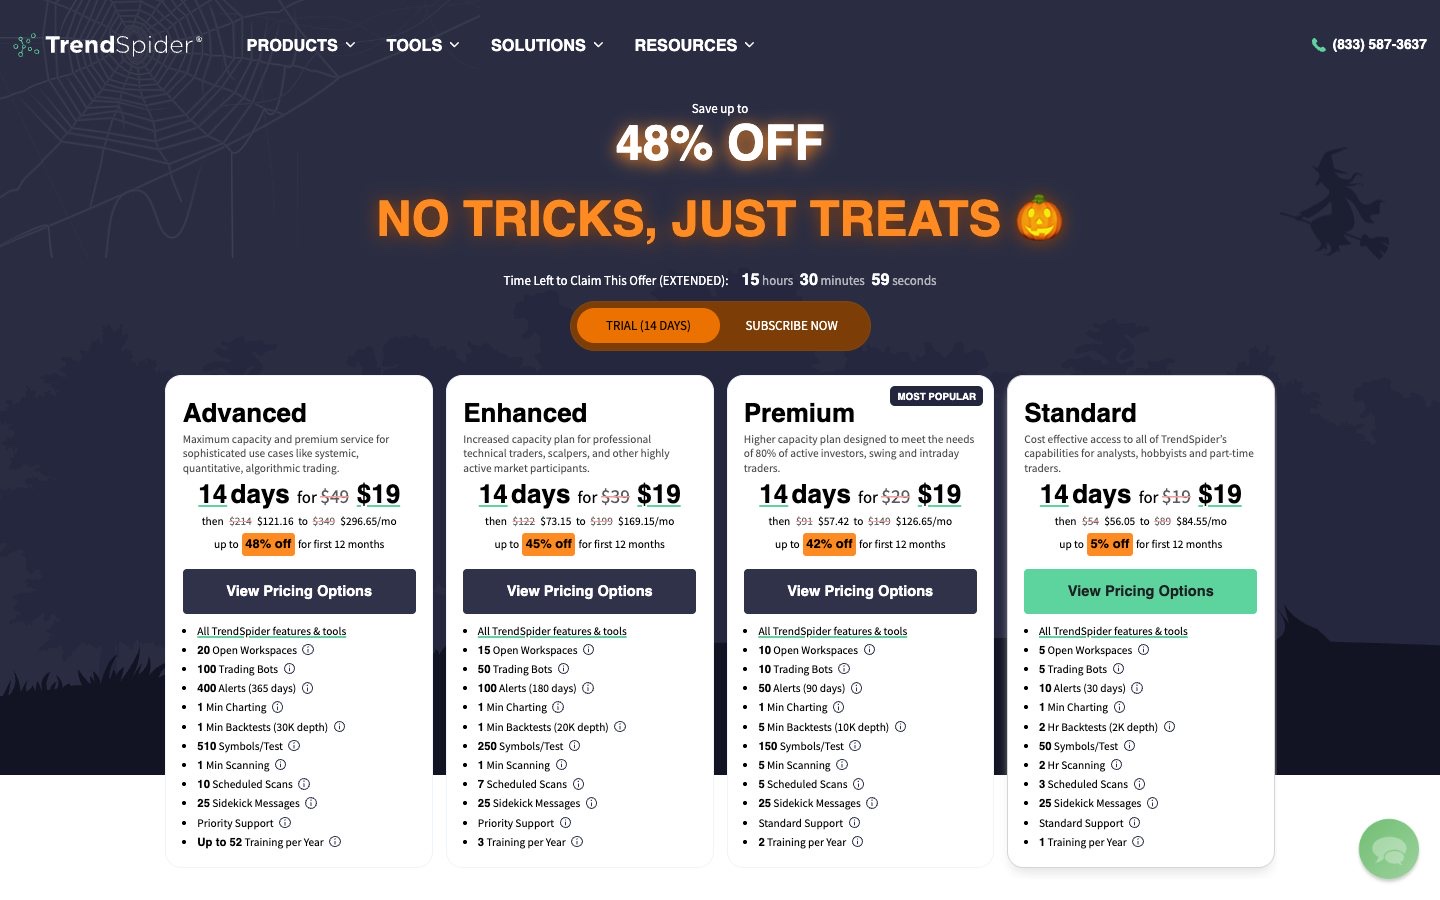
TrendSpider presents subscription access with optional data and feature charges. The official pricing page lists non-professional CME/NYMEX/COMEX/CBOT futures data at $7.50/month, OPRA options data at $9.50/month, and professional US equities data at $29/month. Confirm the base subscription, trial and billing cycle at checkout.
Build the TrendSpider budget from the vendor’s current plan page, the required feature automated trendline detection and chart-analysis tools and any data or report limits connected to not every data feed is included in the base subscription. Compare the actual monthly checkout against the yearly amount paid up front. Where an API or third-party licence is required, treat that as a separate cost rather than an included benefit. Set a calendar reminder for renewal, but do not assume a discounted first year will repeat.
| Cost question | What to verify | Why it matters |
| Billing cycle | Monthly and annual checkout totals | Effective monthly rates can require a year of commitment |
| Data access | Asset coverage, exchange entitlements and history | A missing feed may invalidate your workflow |
| Usage caps | Charts, alerts, exports, API calls or transaction counts | Limits can interrupt an otherwise useful test |
| Commercial rights | Personal, team or commercial data usage | A personal plan may not permit publishing or redistribution |
| Cancellation | Trial conversion and renewal date | Avoid paying for an unused tool |
🎯 Who Should Use TrendSpider?
The strongest potential fit is someone actively working on charting & technical analysis, with enough regular use to justify the subscription. That person should be able to identify a specific recurring problem, choose a success metric and confirm access to the correct data and export format.
TrendSpider is less attractive when a buyer does not regularly use market scans, configurable alerts and strategy testing or cannot explain the information needed from run a fixed scanner condition and inspect signals after bar close. The interface may be extensive without producing a useful record. In that situation, a free chart, a spreadsheet or a narrower competing product can be sufficient. The useful comparison is actual work completed against total annual cost, not the number of dashboards.
⚖️ TrendSpider Alternatives and Comparisons
| Platform | Primary decision dimension | What to check |
| TrendSpider | Charting & Technical Analysis | Vendor plan features, data coverage and total cost |
| TradingView | Different approach to the same task | Workflow and data comparability |
| Finviz | Specialised research or journal tools | Integration and output needs |
| FX Replay | Complementary tool or workflow | Whether it replaces or supplements the stack |
Compare TrendSpider against TradingView with the same instrument, historical window and output requirement. A second candidate such as Finviz may solve only one part of the process. If the job is check the data feed and update schedule for each target market, record which product completes it with fewer undocumented assumptions. Comparing a journal to a screener simply because both concern markets does not establish that one is superior.
🔎 TrendSpider in Practice: Detailed Research Notes
A realistic research session
Imagine a researcher who scans several hundred US stocks each evening for a narrow pattern: price above a moving average, an expanding range and a recent pullback. Drawing those conditions by hand on each chart is cumbersome. TrendSpider’s scans and automated annotations are designed for that kind of repeated screening. A sensible evaluation would fix a universe, run one scan, inspect a small sample of matches and then compare the results with the same conditions written manually. The point is not to count how many charts the tool can label. It is to determine whether its logic generates a list the researcher can explain and review without quietly changing the rules between sessions.
Which features change the work?
TrendSpider offers automated trendlines, chart patterns, dynamic alerts, strategy testing and visual logic tools, but each solves a slightly different problem. Automated trendlines reduce manual drawing work; they do not establish that a breakout is tradable. A scanner can identify conditions on historical data; it does not automatically account for the costs and constraints of entering a position. AI-assisted workflows add another layer: a generated rule may be syntactically valid but economically meaningless. To assess the product responsibly, save a scan definition, read its exact operators, run it over more than one period and record which matches fail a human spot-check. Reproducibility is a stronger benchmark than the number of AI panels.
Market data, definitions and timing
Market coverage requires a separate look from functionality. TrendSpider lists US equity and ETF data, real-time global Forex and crypto feeds, and optional futures or options entitlements. Its pricing documentation identifies non-professional CME-family futures data at $7.50 a month and OPRA options at $9.50; professional equity access and other add-ons may incur different charges. A researcher should verify whether a venue’s data is delayed and whether the vendor defines a continuous futures series the same way as a broker. Scanning on one dataset and executing on another can create misleading differences in price, range and event timing. Keep the market and interval constant in any comparison.
The subscription decision
The displayed price of the core TrendSpider subscription does not necessarily represent the complete bill. Exchange data, Sidekick AI allowances, additional historical backtest depth and third-party indicators are separate cost considerations. The site presents billing and trial offers that can change, so a screenshot of a temporary sale is not a reliable forecast of the next renewal. Before subscribing, calculate the cost of the exact plan and feeds needed for one working month, then multiply annual commitments carefully. If a scanner saves ten minutes a week but requires several premium data products, the justification is weaker than if it replaces a genuinely time-consuming manual routine.
How it compares with alternatives
TradingView emphasizes a broad chart and scripting ecosystem, while TrendSpider is an appealing option when rule-based scans, automated chart geometry and multi-condition alerts are central to the process. Finviz can be simpler for a trader whose real need is an equity screener with fundamentals and a fast visual overview. An FX-specific analyst who only needs a pair of multi-timeframe charts may find both advanced scanning products excessive. The most useful side-by-side experiment is the same market universe, same date range and same conditional rule. If the results differ, inspect data feeds and definitions before attributing the difference to superior analytics.
Where an attractive dashboard can mislead
An automated line can look objective even when small parameter changes produce a very different set of levels. Check how a pattern is anchored and what invalidates it; take note of whether an alert fires before or after a candle closes. For backtests, test a time period that was not used to design the conditions and avoid selecting only spectacular examples from a chart library. If you use a third-party indicator, review its licensing and ongoing compatibility with the platform. More automation can remove repetitive clicking, but it can also make unexplained assumptions harder to notice unless results are independently inspected.
🔍 Related TrendSpider Questions Worth Checking
A TrendSpider market scanner review should begin with a saved universe and a rule that another analyst can reproduce. TrendSpider automated technical analysis may save time on drawing and screening, but the resulting trendlines still need a defined anchoring and invalidation rule. A TrendSpider scanner is most valuable when its matches agree with those explicit conditions.
Before signing up, compare the specific terms of a TrendSpider trial 2026 with the expected workload. TrendSpider futures data cost is particularly important if the scanner covers exchange-traded contracts; the advertised platform price may exclude CME-family data. Note the venue and instrument when pricing an apparently affordable backtesting workflow.
The TrendSpider OPRA options pricing add-on is relevant to an options researcher, not to every equity trader. Likewise, TrendSpider Sidekick AI pricing should be considered only when the assistant actually helps with a documented task. Neither the number of AI prompts nor a colorful chart establishes that the platform’s analytic result is accurate.
A TrendSpider strategy tester evaluation should explain order assumptions, time range and the behavior of alerts at bar close. The question of TrendSpider vs TradingView alerts is better answered with one rule on equivalent data than with a feature-count table. TrendSpider backtesting needs a held-out period before simulated returns are treated as evidence for research.
Look at TrendSpider charting software through the lens of the markets and intervals you actually use. Potential TrendSpider add-on fees may include separate datasets or advanced tools, so annual cost should be based on the working configuration. A reader comparing TrendSpider vs TradingView should account for the difference between automatically generated market scans and manually configured chart scripts.
🔬 TrendSpider — Practical Product Analysis
Automated geometry and alternative chart views
TrendSpider's automated chart annotations can save repetitive drawing, but the tool still needs a clearly understood rule for where a trendline starts and ends. Compare a machine-generated line against the same manually documented swing structure on a fixed universe, then inspect examples where the two disagree. A chart that looks tidy after a breakout may conceal parameters chosen with hindsight. This does not invalidate automation; it shows why the anchor, session and recalculation logic must be part of the evaluation. A meaningful feature comparison records the conditions that create a line rather than merely showcasing a visually persuasive screenshot.
Raindrop Charts represent trading activity differently from conventional candles, while Anchored Volume by Price highlights volume distribution from a chosen reference point. Both can bring information into view that a standard chart does not present as directly. They also introduce choices: the price/volume resolution, the reference anchor and the treatment of incomplete sessions can change the display. The reader should inspect the same symbol and period in an ordinary candle chart before interpreting a new visualization. None of these indicators guarantees that a high-volume region will act as support or that a particular candle shape predicts a reversal.
Scanning, alerts and execution are distinct layers
A market scanner discovers candidates matching a written condition. A strategy tester simulates past outcomes under a rule. An alert monitors that condition as new observations arrive. Connecting an alert to external order execution adds yet another component, with broker credentials, latency and failure handling. TrendSpider offers cloud-based alerts, bots and integrations including SignalStack; that is more specific than saying that the site automatically trades without human involvement. To assess an execution workflow, check the exact supported connection and what happens if an instruction is rejected. A correctly triggered alert is not a verified fill, and a historical strategy result is not evidence of live performance.
Sidekick AI can help translate an idea into a query or accelerate research, but its suggested rule still needs inspection. A request for confirmation on a closed daily candle should not accidentally evaluate the live, unfinished bar. Use an unseen date range to check whether the condition marks the intended events, and document false positives along with successes. The important question is whether a human can understand and reproduce the logic later. Saving time on authoring can be offset if a generated expression silently assumes a different symbol universe or timeframe.
Market data and the actual subscription bill
The vendor quotes optional nonprofessional CME-family futures access at $7.50 per month and OPRA options data at $9.50; additional professional data and advanced features can require different entitlements. The base subscription therefore may not be the full price of the intended research setup. A futures analyst should first verify contract coverage and history, and an options user should test the precise chain and expiration data needed. Compare monthly versus annual contracts and renewal terms at checkout, not merely promotional labels. Where a data stream is delayed, state that in a scanner example rather than treating the difference as a product defect.
The product is most persuasive for a trader repeatedly screening many symbols for the same technical event. A person following two currency pairs by hand may not gain enough from automated scans to justify the subscription. A fair trial fixes the universe and pattern in advance, measures which matches can actually be reviewed, and notes false positives. Comparing its output with TradingView or Finviz should use equivalent dates and price sources. Otherwise the differences may reflect feeds or rule definitions rather than the quality of each platform.
Further decision considerations
A useful test case for a scanner might be a gap-up US equity that then pulls back toward a volume-weighted region. The researcher would define the qualifying gap, minimum volume and accepted price range before running the screen, then check whether the alert fired under the same definition. A chart annotation may help locate the zone, but its exact geometry needs to be documented. Run the setup again on a day with a weak, choppy open: identifying invalid or ambiguous matches is just as important as collecting clean breakouts. That exercise gives a clearer buying signal for TrendSpider than generic claims about an artificial-intelligence feature reducing work.
If a team intends to route scanner conditions into external execution, separate the chart scan, event alert, integration layer and destination broker. The timestamp of a platform alert does not show when an exchange accepted an order or whether the order was partially filled. A research article should note this handoff explicitly. Even when a workflow is described as no-code, its business rules need versioning and a safety procedure for stale data or connection outages.
🧪 How DigiOffly Evaluates This Software
- Define one scanning rule and confirm whether alerts match closed-bar results
- Check the data feed and update schedule for each target market
- Compare backtest assumptions with spreadsheet or independent replay
- Document the monthly subscription plus exchange and add-on fees
For TrendSpider, our proposed test log includes the plan used, the date, the evidence for compare backtest assumptions with spreadsheet or independent replay, and any constraint from third-party strategies, deeper backtesting and ai usage may cost more. These are proposed checks; our current documentation does not establish the results of an independent benchmark. A legitimate revision should link the screenshot, the source record and a clear description of what was and was not verified.
🏆 Final Verdict: TrendSpider Software Review
TrendSpider deserves consideration when its specific features address a documented research or workflow requirement. The main decision remains practical: can you reproduce the result with the data and access included in the plan, and is the recurring cost lower than the time and errors the software can reasonably prevent? TrendSpider is attractive when the research problem is repetitive chart screening instead of drawing everything manually. The decision should hinge on whether scan definitions and test conditions match the trader's rules, not the volume of AI features. Traders working in futures or options must consider exchange entitlements as a separate part of ownership cost.

Frequently Asked Questions
What does TrendSpider do?
TrendSpider is designed around charting & technical analysis. Its primary use depends on the features and data you activate.
Is TrendSpider free?
Review the current trial and free-access conditions on TrendSpider’s official site. Do not assume that a marketing preview includes all paid datasets or that a trial will remain free indefinitely.
How much does TrendSpider cost in 2026?
The subscription and optional market-data or AI add-ons should be priced together. The vendor can change trial and renewal offers. Check the pricing source linked above for the current region, billing cycle and conditions.
Is TrendSpider suitable for beginners?
A beginner can start with one narrow workflow, but should verify terminology, plan restrictions and whether a free alternative meets the need.
Does TrendSpider guarantee profitable trading?
No. Research, charting, journals and backtests cannot guarantee financial outcomes; hypothetical results have important limitations.
What market data does TrendSpider include?
Coverage and history are product- and tier-specific. Check the exact instrument, venue, time interval, licence and data-refresh terms.
Can I use TrendSpider for crypto, forex or stocks?
Check the official supported markets and feature matrix. Product support may differ from the availability of paid real-time exchange feeds.
Can I export my research from TrendSpider?
Review the export, API, CSV and reporting entitlements of the chosen plan. Data licences may limit redistribution.
What are the biggest limitations of TrendSpider?
Not every data feed is included in the base subscription; Automated chart signals require interpretation and validation; Third-party strategies, deeper backtesting and AI usage may cost more.
What are alternatives to TrendSpider?
Start with TradingView, Finviz, FX Replay and compare a consistent task, current pricing and market coverage.
What should I verify before paying for TrendSpider?
Confirm data entitlements, annual versus monthly billing, taxes, usage caps, cancellation and the outputs you actually need.
EXPLORE NEXT ON DIGIOFFLY
🔍 Explore More on DigiOffly
After the TrendSpider review: Automated charting, rule-based screens and alerts are different from broker execution. Explore ways to compare software conditions, integration costs and research workflows.
Compare the right tools
- Software Finder — Identify whether chart automation, equity screening or a simpler charting tool fits.
- Compare Software — Check monitoring, scan and alert features against your shortlist.
- Software directory — Explore the broader software catalogue by actual task, not by trading hype.
Plan your software budget
- Software Cost Calculator — Include specialized futures/options feeds and other optional subscriptions.
- Software Stacks — Plan scans, alerts and external services without duplicating capabilities.
- Verified software deals — Review trial conditions, annual prepayment and renewal costs.
Read related guides
- Automation & No-Code — Research workflow automation independently from trade-execution claims.
- Postman review — Understand API requests and testing when building external integrations.
- Editorial Standards — Learn how we distinguish vendor feature lists from verified results.
- Trading & Market Analysis — Browse trading research and charting tools
- TradingView review — Compare with programmable multi-asset charts
- Finviz review — Try a fundamentals-first US equities screener