

Pricing and product documentation checked on October 29, 2026. This Sentry review uses published vendor material and publicly accessible screenshots, not an authenticated customer account. Features, service quotas and billing terms can change. See the official Sentry pricing source before buying.
Sentry helps developers turn production errors into actionable debugging work. The adoption decision is about signal quality, event volume and release correlation rather than how many projects can send events. The Sentry review asks whether an error event can reach the developer who can resolve it. Trace context, releases, sampling, privacy and the cost of additional events are as important as installing an SDK.
This Sentry review is organized around a developer investigating a concrete production exception. We focus on grouping, source maps, release identification, replay privacy and event costs rather than a long catalog of observability features.
Some DigiOffly links may earn a commission at no added cost to readers. Published vendor features and price terms are examined independently of those links.
📊 Sentry Review Summary
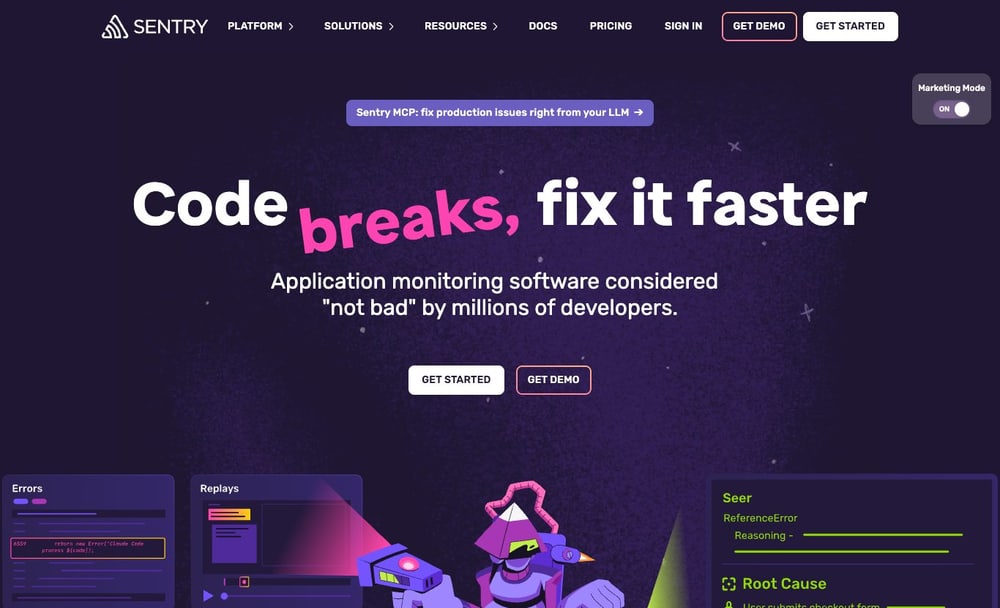
Sentry focuses on getting an actionable application error to the engineer who can resolve it. Release tracking, stack traces and tracing help when events are grouped well. A purchase should reflect actual issue volume, replay privacy and the work spent triaging alerts.
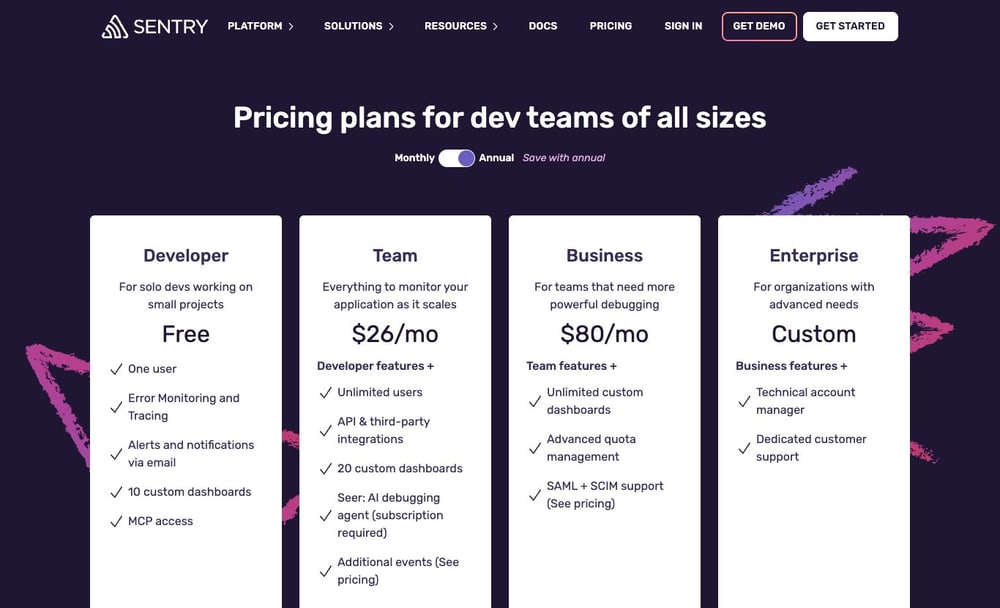
💰 Sentry plans at a glance
| Plan | Official entry price | What to verify |
|---|---|---|
| Developer | Free | Entry-level application monitoring |
| Team | $29/month | Paid team monitoring, usage allowances |
| Business | $89/month | Expanded organization features |
| Enterprise | Contact sales | Custom support and governance |
⚡ Verdict & Operational Fit
A developer observing an unfamiliar production exception needs to know whether it is new, which release introduced it and who owns the affected code. Sentry can support that loop when event grouping is reliable and the SDK has useful context.
Developer-centered error tracking
Sentry groups application errors and connects stack traces with relevant context. Incident usefulness depends on correct instrumentation and release ownership. Sentry application monitoring helps locate errors in deployed code, not identify every infrastructure problem.
Sentry accelerates debugging by aggregating exception telemetry across backend services and frontend clients, binding raw stack traces to contextual metadata like user identifiers, environment variables, and HTTP headers. However, the diagnostic efficacy of this aggregation relies heavily on rigorous SDK initialization and explicit release tracking configurations. For instance, failing to inject distinct release identifiers during CI/CD build pipelines causes runtime errors to fragment across arbitrary deployments, completely obscuring regression timelines. This capability proves invaluable during high-concurrency production surges where manual log parsing becomes entirely intractable. When evaluating this core error-tracking layer—whether utilizing the Free Developer plan or scaling into the Team tier at twenty-nine dollars monthly—technical buyers must verify how cleanly the client-side instrumentation captures custom breadcrumbs without introducing performance degradation or inflating event ingest quotas prematurely.
Which incidents it solves
Exception triage and performance investigations benefit from Sentry; underlying infrastructure capacity and network faults may require other monitoring.
While Sentry excels at pinpointing application-level exceptions, uncaught promise rejections, and slow database queries within specific web frameworks, it is not designed to replace low-level infrastructure monitoring tools like Datadog for tracking raw CPU starvation, memory leaks in underlying virtual machines, or BGP routing faults. Routing every transient network timeout to Sentry can bury genuine application errors. Keep infrastructure alerts in a system that can reveal host and network capacity. Sentry helps when an engineer can open the exception, find the affected release and follow the relevant stack frames. When assessing whether to adopt Sentry alongside existing network monitoring stacks, architectural buyers must verify that error boundaries and transaction tracing are correctly mapped so that infrastructure anomalies are cleanly separated from application code failures.
When not to add another alert feed
Teams already overwhelmed by notifications should define ownership and thresholds before collecting more events.
Deploying real-time error collection without strict governance often exacerbates alert fatigue, turning notification channels into ignored noise rather than actionable signals. A classic implementation failure involves connecting unthrottled production feeds directly to team chat channels without setting severity filters or establishing primary responder ownership, resulting in burnout during minor traffic spikes. Teams already overwhelmed by notification clutter should establish explicit routing hierarchies and volume thresholds before integrating platforms like Sentry or connecting external collaboration tools like GitHub. This cautious approach is particularly useful during rapid organizational scaling or platform migrations. Buyers investigating paid plans, such as the Business tier at eighty-nine dollars monthly, must verify that their chosen notification rules support granular assignment policies and rate-limiting controls to prevent runaway alert volumes from overwhelming engineering resources.
🐛 Error Monitoring
One error may create thousands of identical events. Incorrect grouping hides distinct failures, while no grouping overwhelms the queue. A practical test should compare a repeated exception and a closely related but different one.
Issue grouping and fingerprints
Grouping similar events can reduce noise, but distinct failures may be merged incorrectly. Review issue identity and deduplication after SDK setup. Sentry performance tracking needs useful issue fingerprints so repeated symptoms can be grouped rather than inflating the alert list.
Automatic issue grouping significantly reduces alert volume by consolidating recurring errors into singular dashboard entries, yet overly aggressive deduplication heuristics can dangerously merge distinct underlying failures into one invisible entry. A characteristic failure mode happens when generic database timeout exceptions from completely different microservices are lumped together under a single default fingerprint, obscuring which specific service query is actually failing. Proper tuning requires implementing custom grouping rules or adjusting SDK configuration fingerprints immediately after initial deployment. This grouping capability proves invaluable when managing high-frequency client-side exceptions where identical network blips generate thousands of isolated error logs. When configuring error grouping pipelines, engineering buyers must verify that their fingerprinting logic retains enough granular stack context to differentiate between unrelated bugs while still preventing repetitive noise from overwhelming the triage queue.
Stack traces and source maps
Readable stack traces require version-matched source maps and release identifiers. Without them, a symbolicated production error can remain opaque. The Sentry JavaScript SDK needs release-matched source maps to make minified browser errors understandable.
Translating obfuscated production stack traces into readable code references requires precise upload mechanisms for version-matched source maps during continuous integration builds. Without corresponding release identifiers and correctly uploaded maps, minified JavaScript or compiled binary exceptions remain completely opaque, forcing developers to debug production issues using unhelpful hexadecimal offsets. One risk involves mismatched source map artifacts being uploaded under stale version tags, which points developers to entirely incorrect line numbers and prolongs incident resolution. This symbolication feature is exceptionally useful for modern single-page web applications and mobile apps where client-side code undergoes heavy minification and bundling before deployment. When integrating symbolication workflows alongside version control systems like GitHub, technical buyers must verify that source map upload scripts execute reliably within their deployment pipelines without leaking sensitive source code tokens publicly.
Alert rules and ownership
An alert without a response owner is a reporting artifact. Connect severity, frequency and user impact to the appropriate on-call channel. Sentry performance monitoring React integrations should avoid routing routine slow requests into the same alert as a real regression.
Configuring actionable alert rules requires tying error severity, event frequency, and direct user impact thresholds to designated on-call rotas rather than broadcasting raw notifications into unstructured team feeds. An alert lacking a clearly defined response owner operates merely as an idle reporting artifact that breeds complacency and ignored warnings across engineering departments. A frequent configuration failure involves setting overly sensitive frequency triggers for intermittent background warnings, which causes pager storms and desensitizes teams to critical production outages. Well-designed alert pipelines prove extraordinarily useful for isolating high-priority user-facing crashes from routine background exceptions. When establishing escalation policies across enterprise environments or smaller teams, buyers must verify that alert routing rules integrate smoothly with incident management platforms and strictly enforce accountability by assigning individual service owners to every configured threshold.
📈 Performance & Diagnostics
The same slow page can produce useful traces or meaningless spans depending on sampling and context propagation. Engineers need to choose which transaction data genuinely supports a diagnosis.
Tracing and transaction context
Distributed traces can show where latency accumulates, but sampling and instrumentation gaps can hide the slowest user path. Sentry performance tracing requires sampling choices that preserve diagnostic context without recording unnecessary transactions.
Distributed tracing provides comprehensive end-to-end visibility into multi-service application performance, mapping exactly how latency accumulates across asynchronous network hops and backend database queries. However, improper sampling configurations or incomplete instrumentation gaps can obscure the exact transaction path causing user-facing delays, rendering performance diagnostics misleadingly incomplete. Problems arise when default sampling rates discard high-value transaction outliers during low-traffic windows, hiding critical database lock contention errors from performance dashboards. This telemetry layer proves exceptionally useful for diagnosing complex microservice latency issues where traditional error tracking fails to capture performance degradation. When evaluating transaction monitoring capabilities, technical buyers must verify that distributed tracing headers are correctly propagated across all internal service boundaries and that custom sampling rates are adjusted to capture anomalous slow requests without exceeding ingest limits.
Session Replay and privacy
Replay may help reproduce frontend problems. Configure masking, consent and retention before collecting user interactions. Sentry Session Replay privacy options should mask sensitive fields before real customer interactions are recorded.
Session Replay offers engineering teams a visual mechanism to reproduce complex frontend problems by recording user interactions in the browser environment. While extremely valuable for diagnosing elusive user interface states or unhandled JavaScript exceptions, capturing DOM mutations introduces severe data privacy and compliance risks. Engineering teams must configure strict input masking rules, explicit user consent mechanisms, and tight data retention policies before deploying the tracing SDK to production environments. One risk involves inadvertently recording sensitive user input fields, such as authentication tokens or payment details, due to overly broad CSS selector rules. This feature is particularly useful for consumer-facing web applications where client-side rendering bugs resist traditional stack trace analysis. Prospective buyers should carefully verify how masking is enforced at the client layer and evaluate the exact impact of network payload overhead on overall frontend performance.
Release health and regressions
Associating events with releases helps link regressions to deployments. A release label generated inconsistently by CI undermines that connection. A Sentry SDK Python deployment should report the same release identifier used by the frontend when tracing a cross-service fault.
Associating incoming error events with specific software releases helps engineering organizations link unexpected regressions directly to recent deployments. When configured correctly, this linkage highlights whether an error emerged following a specific code push or infrastructure shift. However, a major failure mode occurs when release labels are generated inconsistently by automated continuous integration pipelines, resulting in fragmented metrics that completely undermine diagnostic reliability. This capability is especially useful for high-velocity teams practicing continuous delivery who require immediate visibility into deployment stability without manually cross-referencing build numbers. Evaluators should thoroughly review how their build systems inject release metadata into the Sentry SDK during compilation. Ensuring uniform tagging across staging and production environments prevents orphaned errors and guarantees that regression alerts fire accurately when problematic code reaches active users, preserving overall trust in operational dashboards.
Workflow roles compared
| Capability | What Sentry contributes | What the team must own |
|---|---|---|
| Tracing and transaction context | Distributed traces can show where latency accumulates, but sampling and instrumentation gaps can hide the slowest user path. | Roles, test data, validation and escalation |
| Session Replay and privacy | Replay may help reproduce frontend problems. Configure masking, consent and retention before collecting user interactions. | Configuration review and failure handling |
| Release health and regressions | Associating events with releases helps link regressions to deployments. A release label generated inconsistently by CI undermines that connection. | Access, recovery and documentation |
🤖 Seer & Workflow
Session Replay and request context can inadvertently capture private data. A monitored application should test masking and server-side event scrubbing before enabling wide collection for customers.
AI-assisted issue investigation
Sentry Seer is a separate $40-per-active-contributor/month service on eligible paid plans, not a per-seat fee for every Sentry user. Review AI access to source code and reliability of proposed fixes. Sentry io pricing should be checked separately from contributor-based charges for optional AI-assisted investigation features.
Sentry Seer introduces artificial intelligence into error investigation, though it operates as a separate paid capability utilizing a contributor-based pricing model. While automated summaries can accelerate root-cause identification by parsing extensive stack traces, organizations must carefully evaluate internal security policies concerning AI access to proprietary source code repositories. A notable failure mode involves the model generating plausible-looking but functionally incorrect code patches that can introduce subtle logic flaws if accepted blindly by developers. This advanced tool is most useful for overburdened engineering organizations trying to triage high volumes of repetitive runtime exceptions quickly. Decision-makers should verify exactly how code context is transmitted and stored, and whether intellectual property agreements protect internal codebases from being leveraged for external model training by third-party sub-processors.
Repository and issue integration
Connect GitHub or GitLab to associate errors with commits. Avoid giving an integration broader repository permissions than necessary.
Connecting version control platforms like GitHub or GitLab allows Sentry to associate runtime errors directly with specific code commits and contributing authors. This integration bridges the gap between observability data and version control, streamlining accountability when bugs surface in production environments. However, a significant operational risk arises when administrators grant the integration overly broad repository permissions, exposing sensitive corporate codebases to unnecessary security vulnerabilities if platform credentials are compromised. This functionality is immensely useful for distributed engineering squads that need instant visibility into which pull request introduced a specific regression. Buyers must verify the exact scope of access tokens requested during installation, enforcing the strict principle of least privilege by restricting permissions solely to the specific repositories actively monitored by Sentry project configurations.
Escalation into existing planning
Confirmed issues should reach the team’s actual issue tracker with a reproducible symptom and owner, not a second backlog that nobody maintains.
Bridging error tracking with existing project management tools ensures that confirmed production anomalies transition smoothly into actionable developer tasks. When configured properly, Sentry pushes issues directly to established ticketing systems like Jira or GitHub Issues complete with stack traces and relevant context. A persistent failure mode involves creating a disconnected second backlog inside the error monitoring tool that nobody regularly maintains, leading to neglected bugs and duplicated effort. This feature is particularly useful for mature teams seeking to incorporate error resolution metrics directly into their standard sprint planning cycles. Stakeholders should verify that automated ticket creation includes a clear, reproducible symptom description and an assigned owner to prevent accountability gaps and ensure engineering bandwidth is spent addressing genuine architectural debt rather than ephemeral noise.

💰 Plans & Consumption
The Developer tier makes an initial experiment easy, but production event, trace and replay volume can change the bill. Seer contributor access is another decision and should not be treated as unlimited assistance.
Developer and Team tiers
Sentry’s public material identifies a free Developer option and paid Team pricing. Verify current event allowances and the expected annual cost before enabling every SDK.
Sentry structures its product pricing around distinct usage tiers, explicitly providing a free Developer option alongside a paid Team tier listed at twenty-nine dollars per month. These plans cater to varying organizational scales, but managing consumption requires constant vigilance regarding event ingestion volumes. Problems arise when teams deploy monitoring SDKs across every microservice repository without implementing proper rate limiting or transaction sampling, quickly exhausting monthly event allowances and triggering unexpected overage fees or dropped telemetry. This tiered structure is ideal for growing startups balancing strict observability budgets with baseline error visibility requirements. Buyers must verify the exact current event allowances included in the base subscription and calculate the expected annual cost under peak traffic conditions before rolling out universal tracing across all backend and frontend services.
Business plan and retention
Business is listed at $89 per month in Sentry’s 2026 public guidance. The scope of monitoring, team controls and included events warrants separate confirmation. Sentry pricing plans should be compared using event volume, retention and the team’s actual requirements for roles.
Positioned above entry tiers, the Business plan is listed at eighty-nine dollars per month in Sentry public guidance for two thousand twenty-six, targeting scaling organizations that require advanced administrative capabilities. This plan introduces expanded team controls, granular access management, and enhanced data retention parameters that support complex enterprise workflows. A frequent oversight during evaluation is assuming that higher tier pricing automatically covers unlimited throughput without monitoring event spikes caused by unhandled exceptions in high-traffic loops. This subscription tier is most useful for mid-market companies needing robust role-based governance across multiple autonomous development squads. Decision-makers should separately confirm the exact scope of monitoring features, multi-tenant permission controls, and included event quotas before committing to a long-term software agreement.
Event and AI costs
Errors, transactions, spans, replays and Seer can have distinct usage or contributor charges. High-cardinality telemetry is not automatically better monitoring.
Integrating modern application monitoring requires careful budgeting because errors, transactions, spans, session replays, and AI-driven features like Seer often incur distinct usage tiers or contributor charges. Teams frequently stumble when high-cardinality telemetry floods their ingestion pipeline without delivering proportional debugging clarity, turning a manageable subscription into an unpredictable financial liability. This feature architecture becomes exceptionally useful when diagnosing complex asynchronous bottlenecks or deep stack traces across distributed microservices. However, unchecked span sampling or unconstrained session replays can rapidly exhaust monthly allowances before critical error patterns are even identified. Buyers must verify how quota thresholds are calculated across different telemetry types, whether data drop-offs happen silently at the edge or trigger hard blocks, and how granular rate-limiting rules can be configured in the SDK before deploying changes to high-throughput production environments.

⚖️ Alternatives & Stack
Datadog may already provide infrastructure telemetry and traces, while Sentry helps application developers investigate errors. Run one actual incident scenario to decide whether the two alert streams add clarity or duplicate notifications.
Sentry and Datadog overlap
Sentry focuses on developer diagnostics while Datadog also covers infrastructure, logs and cross-service monitoring. Compare alert responsibility and overlapping data collection. Sentry performance monitoring complements broader Datadog infrastructure signals when developers need a direct route from incident to code.
When evaluating diagnostic stacks, teams often encounter an architectural overlap between Sentry and Datadog, necessitating a clear division of operational responsibilities. Sentry remains specialized in deep code-level exceptions, stack trace parsing, and developer-centric triage, whereas Datadog extends broader coverage into infrastructure metrics, host performance logs, and cross-service infrastructure monitoring. This distinction matters when engineering squads receive conflicting alerts for the same underlying failure, such as a database timeout generating both an application exception and a host-level resource warning. Utilizing both tools effectively requires establishing distinct routing rules to prevent alert fatigue and redundant data ingestion charges. Buyers should audit their current alert pipelines to ensure Sentry handles code-level exceptions while infrastructure teams manage host telemetry, preventing engineers from jumping between overlapping dashboards during critical production outages.
Sentry with Railway and Firebase
Applications on Railway or Firebase can generate Sentry events, but logs, deployment visibility and billing remain separate concerns.
Deploying modern applications on platform-as-a-service providers like Railway or serverless ecosystems like Firebase simplifies infrastructure management, but integrating Sentry requires understanding where platform boundaries begin and end. While these environments can easily emit runtime exceptions and trace events to Sentry via standard SDK integrations, native platform logs, deployment version tracking, and underlying infrastructure billing remain entirely separate operational concerns. One risk involves assuming that hosting an application on a managed service automatically correlates error events with specific Git commits or container restarts without explicitly configuring release tracking and environment tags in the initialization code. This setup proves invaluable for catching unhandled promise rejections or backend failures in serverless functions without maintaining custom logging servers. Buyers must verify how deployment hooks integrate with their hosting workflow to maintain accurate release mapping.
Open-source and self-hosting
A self-hosted option changes data custody but transfers upgrade, storage, backup and availability responsibilities to your team.
Opting for a self-hosted Sentry deployment alters data custody and compliance postures, but it fundamentally transfers all infrastructure maintenance, upgrade paths, storage scaling, and high-availability responsibilities directly to internal engineering teams. While keeping telemetry data within private network perimeters satisfies strict corporate governance rules, managing the underlying database clusters, worker queues, and cache layers introduces a significant operational tax that can easily rival the cost of a managed subscription. This approach becomes useful for organizations bound by stringent data residency mandates that prohibit sending raw stack traces to third-party cloud services. However, failing to provision adequate database resources or neglecting routine migration procedures often leads to silent ingestion drops during high-traffic incidents. Buyers must verify that their internal platform engineering capacity can sustain ongoing maintenance before committing to a self-hosted architecture.
Alternatives and complements
| Software | Relationship to Sentry | Key question |
|---|---|---|
| Datadog | Alternative or complementary tool | Which exact workflow changes? |
| GitHub | Alternative or complementary tool | Would this duplicate a paid function? |
| Firebase | Complementary part of stack | How are permissions and failures handed off? |
🧪 Pilot & Verdict
Inject a controlled error in staging, record its release tag, then verify that a different engineer can identify the code change and clear the notification. That is more persuasive than seeing a dashboard with green status indicators.
Inject a known test error
Trigger a harmless controlled exception in a staging app and verify grouping, source mapping, notification and assignment.
Validating a new error-tracking installation requires injecting a harmless, controlled exception into a non-production staging environment to verify how effectively the platform handles event grouping, source map resolution, notification routing, and issue assignment. Without this controlled pilot step, teams risk discovering critical blind spots, such as minified stack traces pointing to obfuscated production bundle lines or alerts failing to reach the correct on-call rotation channel, only after a real customer-facing outage occurs. This verification process is exceptionally useful for ensuring that custom fingerprinting rules and exception filters operate as intended before scaling traffic. One risk involves improper source map uploading during the build pipeline, which leaves errors mapped to incomprehensible compiled code rather than original source files. Buyers should confirm that their CI/CD pipelines correctly upload symbols and map errors cleanly.
Audit sensitive telemetry
Check personally identifiable fields, request headers and replay masking before production ingestion.
Auditing sensitive telemetry before enabling production ingestion is an essential governance step to prevent accidental exposure of personally identifiable information, sensitive request headers, authentication tokens, or unmasked user interface elements in session replays. Relying on default SDK configurations often results in capturing sensitive user data embedded in query strings or payload bodies, creating severe compliance liabilities and security risks. This pre-deployment audit is particularly critical for applications handling financial transactions, healthcare data, or user credentials where data privacy regulations apply. One risk is deploying session replays without strict DOM masking rules enabled, inadvertently recording user passwords or private messages on screen recordings. Buyers must verify that data scrubbing rules, attribute filters, and privacy processors are thoroughly tested and enforced at the SDK initialization layer prior to rollout.
Estimate event rates honestly
Run representative traffic, simulate a burst and compare useful issues versus noise. Choose Sentry when triage improves without an unbounded event bill.
Estimating event consumption requires running representative load tests and simulating traffic bursts against a staging deployment to accurately compare actionable issues against recurring background noise. Without realistic simulation, teams frequently misjudge their monthly event volume, leading to either unexpected billing overages or aggressive sampling rates that discard crucial diagnostic data during peak hours. This evaluation strategy proves valuable for identifying noisy third-party script errors or repetitive network timeouts that threaten to exhaust ingestion quotas. The platform delivers true value when engineering triage workflows become noticeably faster and more focused without driving an unbounded financial burden. Buyers must verify that sample rates, error grouping rules, and inbound filters are finely tuned during the pilot phase to guarantee high signal quality and predictable monitoring costs over time.
🏆 Final Verdict: Is Sentry Worth It?
Sentry is most valuable when errors are grouped usefully and mapped to the release that introduced them. Enable the signals developers actually investigate; recording everything is not automatically better. Review the treatment of customer data and the cost of traces and replays before wider SDK rollout.
For Sentry, inject two distinguishable errors during a staging release and ask another engineer to trace them back to the deployment. Check alert ownership, private data scrubbing and consumption of event allowances before enabling every optional SDK feature.

Frequently Asked Questions
What is Sentry used for?
Sentry supports issue grouping and fingerprints and related developer workflows. Sentry helps developers turn production errors into actionable debugging work. The adoption decision is about signal quality, event volume and release correlation rather than how many projects can send events. Compare its role in a complete software stack before choosing an annual plan.
Is there a Sentry free plan?
Sentry publishes the following plan starting points: Developer Free, Team $29/month ($26/month billed annually), Business $89/month ($80/month billed annually), Enterprise Contact sales. Free access and included services vary by workload; confirm the current official pricing page before relying on an allowance.
How much does Sentry cost in 2026?
Sentry pricing depends on the plan and service unit. Developer Free, Team $29/month ($26/month billed annually), Business $89/month ($80/month billed annually), Enterprise Contact sales. Additional usage, add-ons, seat count or infrastructure charges can change the total invoice. The vendor pricing page is linked in this review.
What are the key Sentry features?
Sentry focuses on tracing and transaction context, session replay and privacy, release health and regressions. Availability and limits depend on the active offering, and not every advertised add-on is included in a standard plan.
Who should consider Sentry?
Sentry helps developers turn production errors into actionable debugging work. The adoption decision is about signal quality, event volume and release correlation rather than how many projects can send events. A buyer should validate role permissions, a realistic workload and who maintains the connection after the initial setup.
How should a team evaluate Sentry security?
For Sentry, set up data scrubbing and review who can inspect stack traces, issues and replays. Send sanitized staging events with fictional secrets to test filtering before production monitoring.
What are Sentry alternatives?
Datadog covers broader infrastructure and APM, while Sentry emphasizes developer-focused errors. Rollbar and Bugsnag are closer error-monitoring alternatives; compare real triage workflows.
Does Sentry integrate with other developer tools?
Sentry links errors to releases, commits and issue trackers when identifiers align. Verify source maps and alert ownership so another engineer can reproduce the route from incident to code.
What are the limitations of Sentry?
Error events, traces, replays and retention settings affect usage differently. Sample representative traffic and inspect SDK behavior before enabling every optional signal or raising plan limits.
How can a team migrate to Sentry?
Inventory SDKs, release naming, alerts and issue owners. Run a second monitor against sanitized staging events, then compare grouping, false alerts and investigation speed before cutover.
How was this Sentry review researched?
DigiOffly checked public Sentry pricing and product documentation on October 29, 2026. Screenshots show official publicly accessible pages. This article does not claim an authenticated company implementation or independently measured uptime.
EXPLORE NEXT ON DIGIOFFLY
🔍 Explore More on DigiOffly
Compare related developer platforms, estimate software costs and navigate DigiOffly guides before adding Sentry to a production stack.
Explore related software
- Development & DevOps — Explore all eight developer software categories and reviews.
- Hosting & Websites — Review hosting and infrastructure choices.
- Automation & No-Code — Find integration and workflow alternatives.
- Datadog review — Infrastructure and observability
- GitHub review — Repository management and code review
Compare your shortlist
- Software Directory — Browse reviewed tools by software category.
- Compare Software — Compare capabilities, billing and compatibility.
- AI Software Finder — Narrow options by your exact engineering workflow.
Plan costs and updates
- Software Cost Calculator — Estimate known license and usage costs.
- Best Value Advisor — Compare products against a practical requirement.
- Deal Alerts — Receive relevant software offers and updates.
- Vercel — Next.js deployment previews and commercial hosting costs