

Vendor information reviewed 2 November 2026. Plan details and known add-on charges are explained in the pricing section, with a direct link to the source. Current vendor pricing.
Editorial disclosure: This is a software and pricing research draft based on the linked vendor documentation, not a claim of a completed personal product benchmark or trading outcome. We do not provide investment, financial or tax advice.
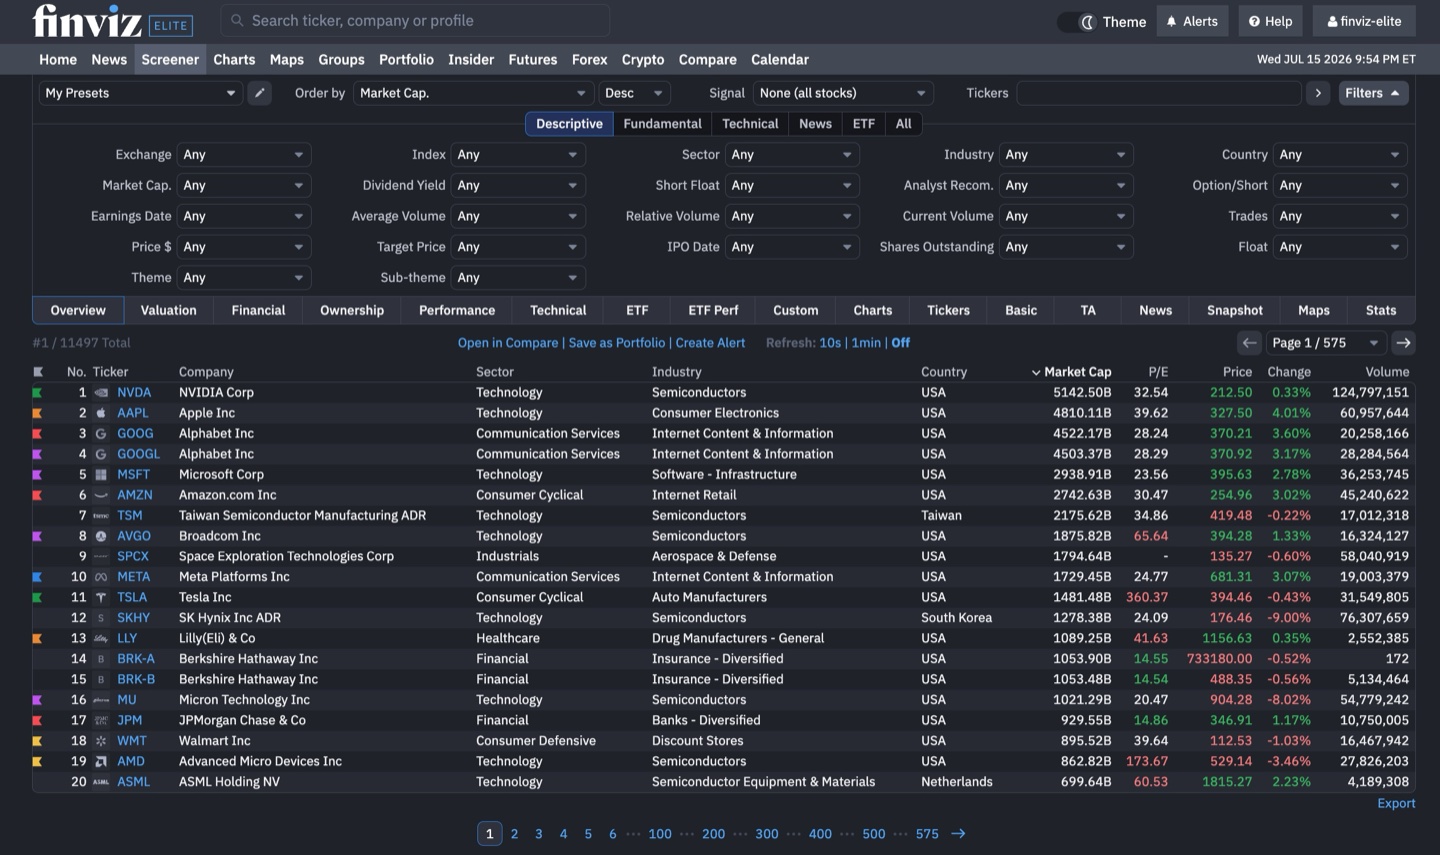
Finviz is a practical starting point for someone narrowing a US equity or ETF universe. A researcher can move from market-wide maps to fundamental filters and then inspect specific securities. The interface is fast to explore, but a company appearing in a screen is not itself a recommendation. The useful output is a dated, documented shortlist with clear filter criteria.
Our evaluation separates the features Finviz advertises from results we can substantiate. Elite provides richer screener controls, real-time quotes, export and alerts, but we have not claimed to measure its speed or the precision of any trial dataset. The buyer can reproduce an example with published filter settings and assess whether the extra subscription replaces an actual manual step.
📊 Finviz Review Summary
Best-fit use: Stocks & ETF Research. Pricing model: free entry tier and optional paid plans. Check the full pricing breakdown below.
The meaningful purchase choice is between a free browsing routine and a paid daily research workflow. A casual investor checking a few tickers may not benefit from export and automated screener notifications. An analyst who saves several screens and shares CSV files may value them more. The quoted annual rate needs to be read as prepayment, not monthly cancellation flexibility.
⚡ Quick Verdict: Is Finviz Worth It?
The practical distinction for Finviz is between a US-equity screener combining valuation, financial and liquidity filters and what a user can validate from the selected plan. The decisive caveat is primarily oriented toward us equities and etfs. Compare that with TradingView before making an annual commitment.
Finviz belongs on a shortlist for US stock discovery. For custom indicator coding and multi-market chart layouts, TradingView may be a more relevant alternative. For automatic technical patterns, TrendSpider may merit comparison. The preferred tool is the one that preserves the user's chosen universe, metrics and observation date across repeated research sessions.
🧠 What Is Finviz?
Finviz is a platform in the Stocks & ETF Research software category. Its relevant published capabilities include a US-equity screener combining valuation, financial and liquidity filters; market maps, etf exposure views and portfolio views; elite real-time and extended-hours data with alerts; exports and configurable layouts for repeatable screeners. This makes it part of the broader trading-software stack, but it should not be confused with a guarantee of successful trades, a regulated investment recommendation or a substitute for evaluating market-data licensing.
A suitable Finviz buyer has a defined task: save a screen with documented fundamentals and trading-volume thresholds. A person needing elite real-time and extended-hours data with alerts may face a different licensing decision from someone who only reads weekly research. Name the instrument, expected export and budget before choosing a subscription tier. This avoids comparing products with different purposes as though their feature lists were directly interchangeable.
🖥️ Interface, Data and Day-to-Day Workflow
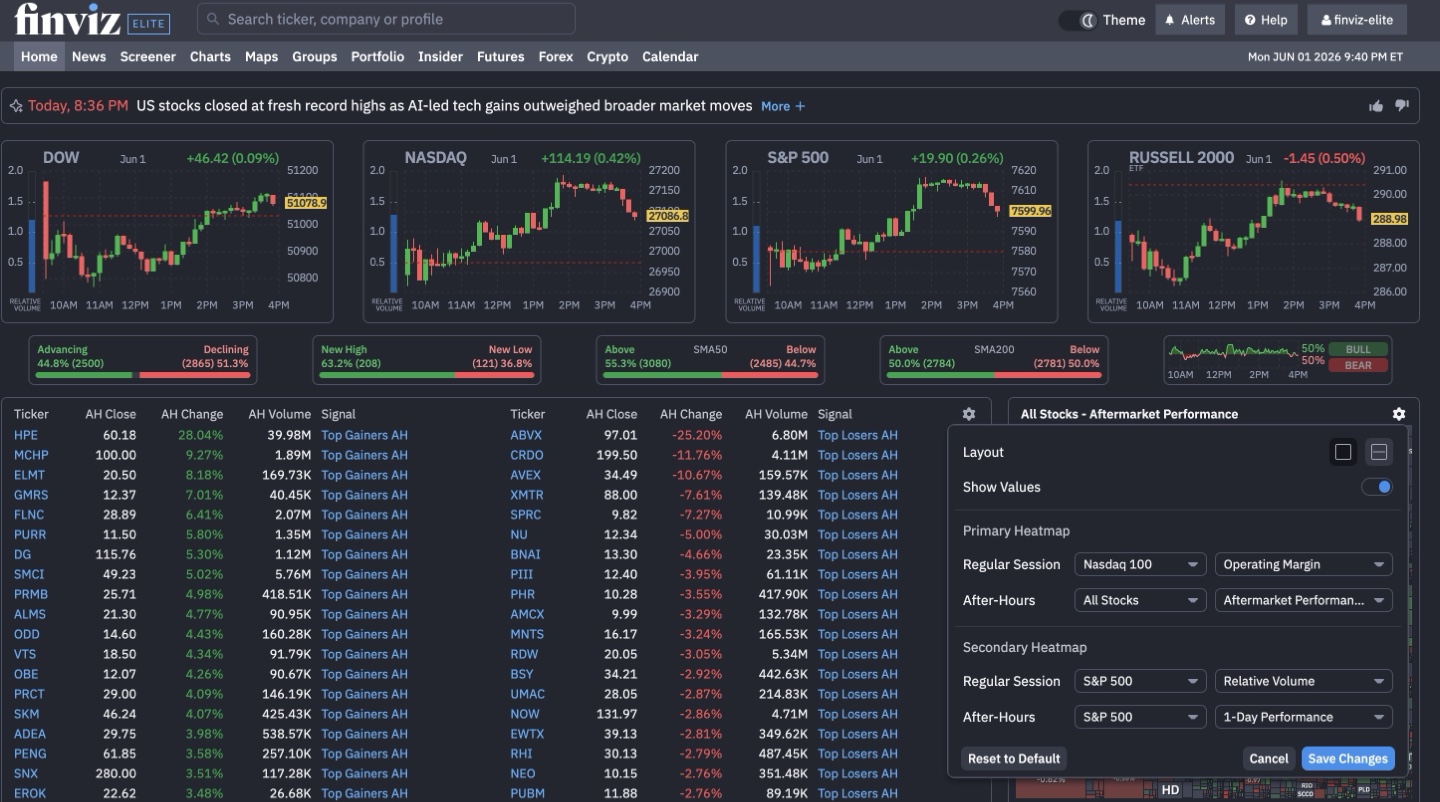
Follow the Finviz workflow from the input to the reported result. Start with check when quote fields update in free and Elite views; then record whether the output makes use of a US-equity screener combining valuation, financial and liquidity filters. If the data comes from another exchange, wallet or account, note that dependency explicitly. A screenshot can help explain the screen but does not independently verify the accuracy of every value it contains.
For Finviz, start with a constrained project: save a screen with documented fundamentals and trading-volume thresholds. Then check when quote fields update in free and Elite views. Treat that as a repeatable acceptance test, not as a trading system. If the result depends on a feed, exchange or report format that is absent from your plan, do not infer that the paid tier will fix it without verifying the entitlement.
🧭 How to Evaluate Finviz Before Subscribing
1. Build a saved screener using fundamentals and liquidity limits
Evaluation note: Before starting this check, record the chosen instrument and session zone. Inspect whether saved settings remain consistent when the platform is reopened. Any mismatch should be described with an exact timestamp rather than dismissed as user error.
2. Compare free and Elite data freshness for a selected ticker
Evaluation note: Run this check against a defined sample and record the limits of the account tier. If the feature is unavailable, note the subscription level rather than treating it as a software malfunction.
3. Review ETF holdings and screening filter availability
Evaluation note: Keep a dated copy of the source input and the result. When external exchange or wallet data is involved, document that dependency so the same exercise can be attempted again.
4. Export screener results and check column consistency
Evaluation note: Compare the output with a second method or a manually checked subset. Explain any disagreement before using the result in a recommendation; a successful screenshot alone does not establish data accuracy.
🛠️ Key Features and Real-World Fit
✓ US stock screener and fundamentals with detailed filters
a US-equity screener combining valuation, financial and liquidity filters: the practical question for Finviz is whether a user can save a screen with documented fundamentals and trading-volume thresholds. Compare the documented output with TradingView where appropriate, and check primarily oriented toward us equities and etfs before treating the feature as a subscription benefit.
✓ Market maps, ETF exposure views and portfolio views
Market maps, ETF exposure views and portfolio views: the practical question for Finviz is whether a user can check when quote fields update in free and Elite views. Compare the documented output with Koyfin where appropriate, and check certain real-time and export features require elite before treating the feature as a subscription benefit.
✓ Elite real-time and extended-hours data with alerts
Elite real-time and extended-hours data with alerts: the practical question for Finviz is whether a user can review ETF holdings and screening filter availability. Compare the documented output with TrendSpider where appropriate, and check complex proprietary screening workflows still need human interpretation before treating the feature as a subscription benefit.
✓ Exports and configurable layouts for repeatable screeners
Exports and configurable layouts for repeatable screeners: the practical question for Finviz is whether a user can export screener results and check column consistency. Compare the documented output with TradingView where appropriate, and check primarily oriented toward us equities and etfs before treating the feature as a subscription benefit.
⚠️ Limitations and Accuracy Risks
- Primarily oriented toward US equities and ETFs
- Certain real-time and export features require Elite
- Complex proprietary screening workflows still need human interpretation
For Finviz, the warning about certain real-time and export features require elite deserves a concrete example before publication. Check review ETF holdings and screening filter availability. If this fails, identify whether the cause is a missing plan entitlement, incompatible input or out-of-date documentation. Do not substitute a generalized claim that all platforms are unreliable, because the specific limitation is what helps a buyer.
💰 Finviz Pricing and Total Ownership Cost
Finviz offers a free browsing tier and paid Elite access. Vendor pricing lists Elite at $39.50 per month on a monthly plan, or $299.50 per year (about $24.96/month effective). A free Elite trial may convert automatically to a paid subscription unless canceled.
Build the Finviz budget from the vendor’s current plan page, the required feature a US-equity screener combining valuation, financial and liquidity filters and any data or report limits connected to primarily oriented toward us equities and etfs. Compare the actual monthly checkout against the yearly amount paid up front. Where an API or third-party licence is required, treat that as a separate cost rather than an included benefit. Set a calendar reminder for renewal, but do not assume a discounted first year will repeat.
| Cost question | What to verify | Why it matters |
| Billing cycle | Monthly and annual checkout totals | Effective monthly rates can require a year of commitment |
| Data access | Asset coverage, exchange entitlements and history | A missing feed may invalidate your workflow |
| Usage caps | Charts, alerts, exports, API calls or transaction counts | Limits can interrupt an otherwise useful test |
| Commercial rights | Personal, team or commercial data usage | A personal plan may not permit publishing or redistribution |
| Cancellation | Trial conversion and renewal date | Avoid paying for an unused tool |
🎯 Who Should Use Finviz?
The strongest potential fit is someone actively working on stocks & etf research, with enough regular use to justify the subscription. That person should be able to identify a specific recurring problem, choose a success metric and confirm access to the correct data and export format.
Finviz is less attractive when a buyer does not regularly use market maps, etf exposure views and portfolio views or cannot explain the information needed from save a screen with documented fundamentals and trading-volume thresholds. The interface may be extensive without producing a useful record. In that situation, a free chart, a spreadsheet or a narrower competing product can be sufficient. The useful comparison is actual work completed against total annual cost, not the number of dashboards.
⚖️ Finviz Alternatives and Comparisons
| Platform | Primary decision dimension | What to check |
| Finviz | Stocks & ETF Research | Vendor plan features, data coverage and total cost |
| TradingView | Different approach to the same task | Workflow and data comparability |
| Koyfin | Specialised research or journal tools | Integration and output needs |
| TrendSpider | Complementary tool or workflow | Whether it replaces or supplements the stack |
Compare Finviz against TradingView with the same instrument, historical window and output requirement. A second candidate such as Koyfin may solve only one part of the process. If the job is check when quote fields update in free and Elite views, record which product completes it with fewer undocumented assumptions. Comparing a journal to a screener simply because both concern markets does not establish that one is superior.
🔎 Finviz in Practice: Detailed Research Notes
A realistic research session
A Finviz workflow should begin with a research question, not a top-gainers page. For instance, an investor could seek US-listed companies above a minimum market capitalization, with positive operating margins and sufficient average volume for the intended position size. A different screen could find ETFs in a target sector with acceptable cost and diversification. Save each filter set and return to it the following week. The output will change as markets and fundamentals update, but the rules should remain explicit. This process reveals whether the free filters are adequate or whether Elite’s extra columns, exports and alerts genuinely help.
Which features change the work?
The signature strengths of Finviz are its stock screener, market heatmaps and quick navigation between ticker-level research and filtered lists. Elite adds real-time data, more flexible screener layouts, exports, alerts and richer charts. The exact distinction is not merely cosmetic. If you need to retain a CSV of candidates at a known timestamp, export rights and columns become part of the research method. If you only check several companies before earnings, the free interface may be enough. A map is an effective first-pass visual, but sector coloring can hide underlying weights, late data or a particularly influential company moving the entire group.
Market data, definitions and timing
Finviz mainly serves US equities and ETFs. That focus is a strength for its intended reader but a limitation for a multi-asset trader expecting direct Forex execution or full crypto derivatives positioning. Note the freshness of the specific metric: real-time quotes do not imply that fundamental statements update every minute. The official knowledge base also notes that historical screener results are not offered in the same way as historical chart data. This matters for anyone who wants to test a screen retrospectively. Rebuilding a screen today and treating the current survivors as if they were known years ago introduces survivorship and hindsight bias.
The subscription decision
Finviz lists Elite at $39.50 on monthly billing or $299.50 for a year, equivalent to approximately $24.96 per month over that year. The free trial can become a paid subscription if it is not canceled. This is enough detail to estimate the base licence, but it does not answer whether the upgrade is worth it. Record how often you export data, need price alerts or monitor extended-hours quotes. A long-term investor doing a monthly screen may not require every Elite capability; an analyst screening every market session may value saved presets and faster lists more highly. Confirm tax and current checkout terms.
How it compares with alternatives
Finviz and TradingView overlap on stock research but emphasize different activities. Finviz starts with screens and market-wide discovery, whereas TradingView offers a more elaborate charting and indicator workspace across many asset classes. Koyfin and Stock Rover are also worth considering for fundamentals and portfolio analysis, depending on the depth and presentation needed. A valid comparison should use the same ten securities, the same filing period and the same metric definitions, such as trailing versus forward earnings. Different ratios are not proof one service is wrong; they may reflect different reporting windows or adjustments.
Where an attractive dashboard can mislead
The easiest mistake is designing a screen after seeing which stocks subsequently performed well. That is not a fair test of a discovery method. Another is confusing a low average daily volume with a tradable position size in premarket conditions. Trading risks are not removed because Finviz displays a clear liquidity number. Before trusting any screener-generated shortlist, check major news, corporate actions, financial report dates and whether multiple share classes are being counted as distinct opportunities. For ETF analysis, the ticker alone cannot convey holdings turnover or the concentration of the largest positions.
🔍 Related Finviz Questions Worth Checking
A Finviz stock heatmap review is useful for seeing broad sector movement, but colors cannot substitute for the underlying constituents and weights. To understand Finviz Elite monthly cost, start with how often you need fresh quotes, exports and custom screener views. The Finviz stock screener is most useful when its criteria are defined before looking at recent winners.
An analyst considering a Finviz Elite annual subscription should compare the total prepayment with the flexibility of monthly billing. The Finviz free screener limits may be acceptable if the job is a weekly shortlist, rather than continuous intraday filtering. A sensible Finviz Elite vs free test uses the same ten tickers and checks which limits actually affect the output.
For ETF research, Finviz ETF holdings data should be considered alongside concentration, sector classification and fund fees. Finviz real-time premarket data can have different assumptions from regular-session pricing. Readers checking Finviz Elite pricing should verify which data and notification functions are part of the tier they are about to purchase.
Try Finviz advanced stock filters with liquidity, earnings and valuation rules that are written down in advance. Finviz stock alerts add value when they cover a real monitoring requirement, not when the software produces more notifications than anyone can evaluate. A buyer who needs extensive chart scripting rather than fundamental screening may prefer another research tool.
Before relying on Finviz data export, verify the columns, format and date on a trial sample. A Finviz vs TradingView screening comparison should use identical ticker universes and clearly defined metrics. Someone seeking a Finviz alternative should identify whether the missing requirement is portfolio analytics, deeper fundamentals or chart execution rather than moving to a more expensive service blindly.
🔬 Finviz — Practical Product Analysis
A screen is a research shortlist, not a trading rule
Consider two distinct Finviz screens: liquid US companies with defined balance-sheet metrics, and ETFs with particular sector exposures. Neither should be evaluated by retroactively selecting the securities that performed well. Record the precise filters and the date used, and check whether an apparent value candidate reflects one-off earnings or stale statements. Average daily volume can be an imperfect proxy for the liquidity available at a specific time. A screener simplifies a broad universe into manageable research; it cannot replace reviewing filings, corporate actions or upcoming earnings. The goal is to explain why each symbol appeared, not to call every match a buy signal.
The market map is excellent for spotting pockets of strength and weakness, but its visual weight can be affected by the largest constituents. A green sector tile does not prove that the average company in the group advanced. ETF research needs comparable care: two funds categorized under the same theme can have different holdings, concentration and costs. Finviz Elite advertises detailed ETF holdings and visualizations, which may make that part of the subscription more valuable to a portfolio analyst than another intraday indicator. A useful review ties the visualization to a concrete research question and states what it cannot establish.
What the Elite licence adds
Finviz lists Elite at $39.50 on monthly billing and $299.50 for a year, which is approximately $24.96 per month when prepaid annually. The trial automatically renews into a paid subscription unless canceled. The paid tier advertises real-time market data including premarket and after-hours quotes, an ad-free workspace, additional screening filters, saved presets, richer chart layouts, alerts and export to spreadsheet formats. These are testable workflow differences. Someone running one weekly valuation filter may be satisfied with the free interface; an analyst exporting daily screens and monitoring new matches may benefit more. Neither use case requires a fabricated time-savings percentage.
For a repeatable test, build a small screen with documented thresholds, save it, inspect several constituent charts and export a CSV. Verify that the selected fields, price timestamps and reported ratios correspond to the expectations. Real-time quotes do not make all fundamental accounting data update in real time; filings arrive on their own schedule. Readers should check the period underlying a valuation ratio before comparing two companies. Elite's included market-data claims should not be confused with unlimited professional redistribution rights, which can depend on separate legal terms.
Comparison boundaries and historical bias
Finviz concentrates on stock and ETF discovery. TradingView has broader multi-market charting and programmable studies; TrendSpider emphasizes automated technical scanning. The most useful comparison starts with the same equity universe and metric definitions, not three screenshots of different dashboards. For someone working primarily in Forex, a stock screener may be irrelevant even when the product also displays currency charts. For an investor doing fundamental screening, a complex technical scripting environment might be unnecessary. The task should determine the vendor shortlist rather than overall market popularity.
A current screen cannot be projected backwards as a reliable historical stock selection strategy. Companies that no longer exist may be absent, financial fields may contain revisions, and a recent strong performer may look attractive because the analyst already knows what happened. Proper backtesting requires historical constituents and point-in-time filings, along with realistic transaction assumptions. Finviz remains useful as a fast research interface, but a present-day shortlist should not be published as if it were an independently verified return model.
Further decision considerations
The value of Elite's CSV export is easy to explain with a concrete desk routine. Imagine a weekly watchlist prepared for an investment team: analysts narrow the universe using consistent size, valuation and liquidity filters, download the fields needed for a shared worksheet and attach the source date. Repeatability is essential because different earnings quarters can make a ratio look like it changed when the underlying accounting period changed. The exported list should never be described as a validated investment strategy. It is the beginning of further research and a documented handoff between people.
An ETF screen adds another subtlety: category labels may hide concentration in the same mega-cap holdings, and historical fund holdings can change between rebalance dates. Someone comparing two nominally diversified funds should inspect top holdings and sector overlap rather than relying on performance charts alone. A platform that allows deeper holdings inspection can therefore save work for this research question even if a casual stock trader would never use that feature.
One More Practical Research Consideration
A further screen-quality issue is the treatment of company events. A stock can shift sectors, consolidate shares or change its reporting currency, while a saved screener continues to show a familiar ticker. If the user distributes lists to colleagues, the report should include the date of extraction and any corporate-action caveat affecting the analysis. This is particularly relevant when a filter is built around trailing multiples or dividend yields, because those values may reflect events outside the regular reporting cycle. Finviz is useful for finding questions worth investigating, but the primary filings remain the authority for a consequential investment decision.
🧪 How DigiOffly Evaluates This Software
- Build a saved screener using fundamentals and liquidity limits
- Compare free and Elite data freshness for a selected ticker
- Review ETF holdings and screening filter availability
- Export screener results and check column consistency
For Finviz, our proposed test log includes the plan used, the date, the evidence for review etf holdings and screening filter availability, and any constraint from complex proprietary screening workflows still need human interpretation. These are proposed checks; our current documentation does not establish the results of an independent benchmark. A legitimate revision should link the screenshot, the source record and a clear description of what was and was not verified.
🏆 Final Verdict: Finviz Software Review
Finviz deserves consideration when its specific features address a documented research or workflow requirement. The main decision remains practical: can you reproduce the result with the data and access included in the plan, and is the recurring cost lower than the time and errors the software can reasonably prevent? Finviz is a research and screening workspace, not a broker. Its real strength for a value-minded investor is rapidly narrowing a US-equity universe by transparent criteria. Before subscribing, compare a saved screening workflow under free limits and Elite. Be deliberate about earnings, liquidity, and corporate-action context in any screening rule.

Frequently Asked Questions
What does Finviz do?
Finviz is designed around stocks & etf research. Its primary use depends on the features and data you activate.
Is Finviz free?
Finviz has a free entry option or limited free access. Check which functions are included before relying on it for an ongoing workflow; paid features and data may require a subscription.
How much does Finviz cost in 2026?
The vendor lists Elite at $39.50 with monthly billing or $299.50 for a year, before applicable tax. Check the pricing source linked above for the current region, billing cycle and conditions.
Is Finviz suitable for beginners?
A beginner can start with one narrow workflow, but should verify terminology, plan restrictions and whether a free alternative meets the need.
Does Finviz guarantee profitable trading?
No. Research, charting, journals and backtests cannot guarantee financial outcomes; hypothetical results have important limitations.
What market data does Finviz include?
Coverage and history are product- and tier-specific. Check the exact instrument, venue, time interval, licence and data-refresh terms.
Can I use Finviz for crypto, forex or stocks?
Check the official supported markets and feature matrix. Product support may differ from the availability of paid real-time exchange feeds.
Can I export my research from Finviz?
Review the export, API, CSV and reporting entitlements of the chosen plan. Data licences may limit redistribution.
What are the biggest limitations of Finviz?
Primarily oriented toward US equities and ETFs; Certain real-time and export features require Elite; Complex proprietary screening workflows still need human interpretation.
What are alternatives to Finviz?
Start with TradingView, Koyfin, TrendSpider and compare a consistent task, current pricing and market coverage.
What should I verify before paying for Finviz?
Confirm data entitlements, annual versus monthly billing, taxes, usage caps, cancellation and the outputs you actually need.
EXPLORE NEXT ON DIGIOFFLY
🔍 Explore More on DigiOffly
After the Finviz review: A stock screener helps assemble a research shortlist; it does not verify the investment decision. Compare data, exports and budget before upgrading to Elite.
Compare the right tools
- Software Finder — Find out whether your real need is a stock screener, charts or analytics.
- Compare Software — Compare screener filters, data freshness and exports across tools.
- Software directory — Explore software for research beyond the equity market.
Plan your software budget
- Software Cost Calculator — Compare Elite monthly billing with the full annual prepayment.
- Software Stacks — Combine discovery, research and record-keeping without feature overlap.
- Verified software deals — Check whether a trial actually reduces total first-year cost.
Read related guides
- Analytics & Product Insights — Explore reporting and insight tools for adjacent research workflows.
- Best Software — Review other software buying guides before expanding a research stack.
- Editorial Standards — Check our rules for quoting plan differences and data limitations.
- Trading & Market Analysis — Explore complementary market-analysis tools
- TradingView review — Compare more flexible multi-market charting
- TrendSpider review — Review automated technical screening