

Vendor information reviewed 2 November 2026. Plan details and known add-on charges are explained in the pricing section, with a direct link to the source. Current vendor pricing.
Editorial disclosure: This is a software and pricing research draft based on the linked vendor documentation, not a claim of a completed personal product benchmark or trading outcome. We do not provide investment, financial or tax advice.
TradingView is a flexible environment for people who already know which markets and intervals they need to observe. Its value is strongest when a chart layout, drawing convention and alerts can be reused without rebuilding them every morning. Its public Pine ecosystem adds scope, but users must understand the scripts they adopt. This review concerns that software workflow, not the investment merits of any symbol plotted on its charts.
Price-chart software is easy to oversell through a sophisticated-looking screenshot. For TradingView we focus instead on whether the displayed exchange, session hours and quote entitlement match the user's actual requirement. We have checked the publicly described tools and subscription structure; results from independently executed account benchmarks would require dated login-level evidence. A reader should not interpret our proposed tests as completed experiments.
📊 TradingView Review Summary
Best-fit use: Charting & Technical Analysis. Pricing model: free entry tier and optional paid plans. Check the full pricing breakdown below.
The upgrade question is concrete: which restriction prevented the charting task? Essential's number of simultaneous charts may be enough for an analyst comparing daily context with intraday timing; an active alert desk may face a different constraint. Pine studies, replay depth and paid exchange feeds have separate dependencies. More indicators are not a benefit when the underlying provider or script logic remains unexplained.
⚡ Quick Verdict: Is TradingView Worth It?
The practical distinction for TradingView is between cross-market chart layouts and reusable community Pine studies and what a user can validate from the selected plan. The decisive caveat is data entitlements and professional exchange fees can be separate. Compare that with TrendSpider before making an annual commitment.
The appropriate shortlist includes TradingView when technical charting and editable studies are central to the job, and alternatives when the job is primarily equity screening or historical practice. This is an editorial fit assessment based on product documentation, not a claim of profitable live trading. Any subsequent rating needs a reproducible test case tied to its date, source and plan.
🧠 What Is TradingView?
TradingView is a platform in the Charting & Technical Analysis software category. Its relevant published capabilities include cross-market chart layouts and reusable community Pine studies; pine script indicators, strategy testing and chart alerts; bar replay for historical scenario practice; stock and other market screeners, lists and drawing tools. This makes it part of the broader trading-software stack, but it should not be confused with a guarantee of successful trades, a regulated investment recommendation or a substitute for evaluating market-data licensing.
A suitable TradingView buyer has a defined task: create a watchlist with saved higher- and lower-timeframe layouts. A person needing bar replay for historical scenario practice may face a different licensing decision from someone who only reads weekly research. Name the instrument, expected export and budget before choosing a subscription tier. This avoids comparing products with different purposes as though their feature lists were directly interchangeable.
🖥️ Interface, Data and Day-to-Day Workflow
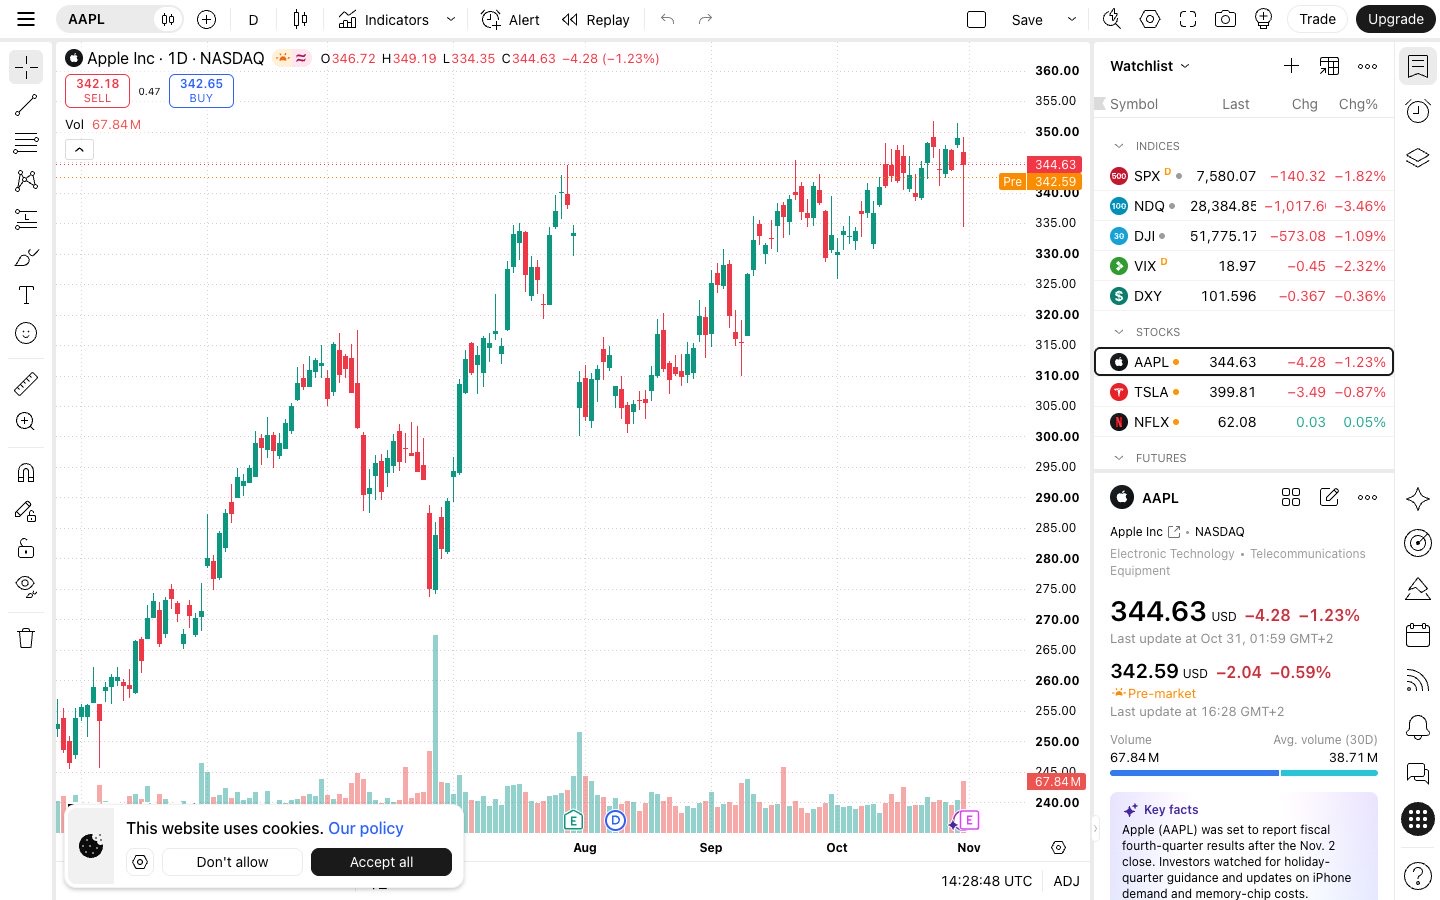
Follow the TradingView workflow from the input to the reported result. Start with verify conditional alerts against the selected subscription’s quotas; then record whether the output makes use of cross-market chart layouts and reusable community Pine studies. If the data comes from another exchange, wallet or account, note that dependency explicitly. A screenshot can help explain the screen but does not independently verify the accuracy of every value it contains.
For TradingView, start with a constrained project: create a watchlist with saved higher- and lower-timeframe layouts. Then verify conditional alerts against the selected subscription’s quotas. Treat that as a repeatable acceptance test, not as a trading system. If the result depends on a feed, exchange or report format that is absent from your plan, do not infer that the paid tier will fix it without verifying the entitlement.
🧭 How to Evaluate TradingView Before Subscribing
1. Build a multi-timeframe watchlist and save a repeatable chart layout
Evaluation note: Before starting this check, record the chosen instrument and session zone. Inspect whether saved settings remain consistent when the platform is reopened. Any mismatch should be described with an exact timestamp rather than dismissed as user error.
2. Test alert limits and multi-condition alerts in the chosen plan
Evaluation note: Run this check against a defined sample and record the limits of the account tier. If the feature is unavailable, note the subscription level rather than treating it as a software malfunction.
3. Replay a defined historical session and compare signal timestamps
Evaluation note: Keep a dated copy of the source input and the result. When external exchange or wallet data is involved, document that dependency so the same exercise can be attempted again.
4. Check symbol exchange and real-time versus delayed entitlement
Evaluation note: Compare the output with a second method or a manually checked subset. Explain any disagreement before using the result in a recommendation; a successful screenshot alone does not establish data accuracy.
🛠️ Key Features and Real-World Fit
✓ Flexible multi-market charting and a broad community script library
cross-market chart layouts and reusable community Pine studies: the practical question for TradingView is whether a user can create a watchlist with saved higher- and lower-timeframe layouts. Compare the documented output with TrendSpider where appropriate, and check data entitlements and professional exchange fees can be separate before treating the feature as a subscription benefit.
✓ Pine Script indicators, strategy testing and chart alerts
Pine Script indicators, strategy testing and chart alerts: the practical question for TradingView is whether a user can verify conditional alerts against the selected subscription’s quotas. Compare the documented output with Finviz where appropriate, and check historical replay depth, chart counts and alerts depend on plan before treating the feature as a subscription benefit.
✓ Bar Replay for historical scenario practice
Bar Replay for historical scenario practice: the practical question for TradingView is whether a user can replay a defined historical session and compare signal timestamps. Compare the documented output with FX Replay where appropriate, and check backtested fills do not automatically model actual brokerage execution before treating the feature as a subscription benefit.
✓ Stock and other market screeners, lists and drawing tools
Stock and other market screeners, lists and drawing tools: the practical question for TradingView is whether a user can check symbol exchange and real-time versus delayed entitlement. Compare the documented output with TrendSpider where appropriate, and check data entitlements and professional exchange fees can be separate before treating the feature as a subscription benefit.
⚠️ Limitations and Accuracy Risks
- Data entitlements and professional exchange fees can be separate
- Historical replay depth, chart counts and alerts depend on plan
- Backtested fills do not automatically model actual brokerage execution
For TradingView, the warning about historical replay depth, chart counts and alerts depend on plan deserves a concrete example before publication. Check replay a defined historical session and compare signal timestamps. If this fails, identify whether the cause is a missing plan entitlement, incompatible input or out-of-date documentation. Do not substitute a generalized claim that all platforms are unreliable, because the specific limitation is what helps a buyer.
💰 TradingView Pricing and Total Ownership Cost
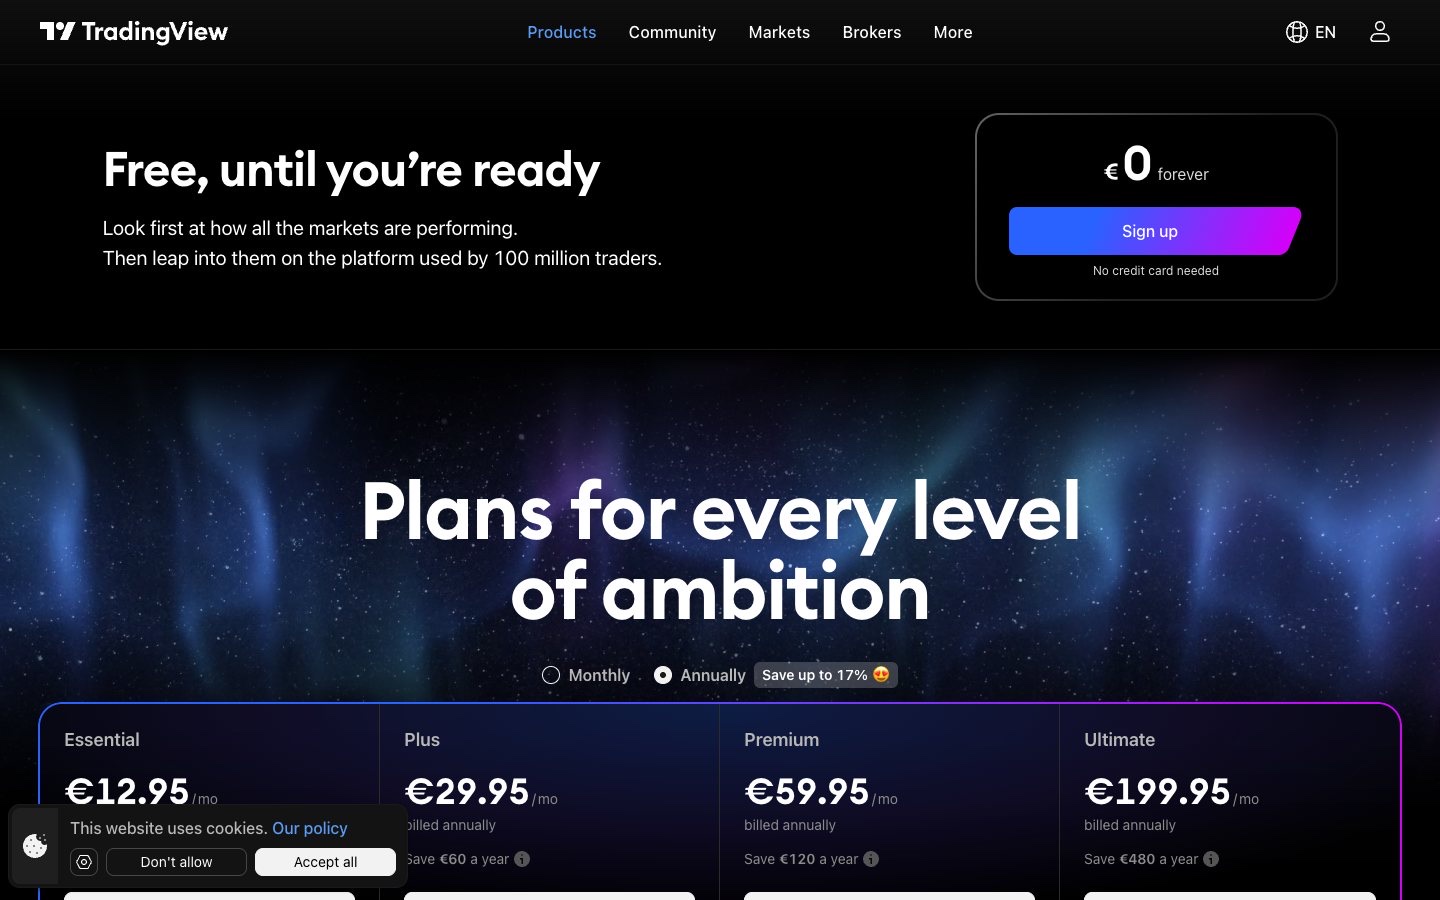
Basic is free. Essential, Plus, Premium and Ultimate are paid tiers; the vendor's annual-billing promotional examples include Essential $12.95/month, Plus $29.95/month, Premium $59.95/month and Ultimate $199.95/month. Local taxes and exchange feeds may cost extra.
Build the TradingView budget from the vendor’s current plan page, the required feature cross-market chart layouts and reusable community Pine studies and any data or report limits connected to data entitlements and professional exchange fees can be separate. Compare the actual monthly checkout against the yearly amount paid up front. Where an API or third-party licence is required, treat that as a separate cost rather than an included benefit. Set a calendar reminder for renewal, but do not assume a discounted first year will repeat.
| Cost question | What to verify | Why it matters |
| Billing cycle | Monthly and annual checkout totals | Effective monthly rates can require a year of commitment |
| Data access | Asset coverage, exchange entitlements and history | A missing feed may invalidate your workflow |
| Usage caps | Charts, alerts, exports, API calls or transaction counts | Limits can interrupt an otherwise useful test |
| Commercial rights | Personal, team or commercial data usage | A personal plan may not permit publishing or redistribution |
| Cancellation | Trial conversion and renewal date | Avoid paying for an unused tool |
🎯 Who Should Use TradingView?
The strongest potential fit is someone actively working on charting & technical analysis, with enough regular use to justify the subscription. That person should be able to identify a specific recurring problem, choose a success metric and confirm access to the correct data and export format.
TradingView is less attractive when a buyer does not regularly use pine script indicators, strategy testing and chart alerts or cannot explain the information needed from create a watchlist with saved higher- and lower-timeframe layouts. The interface may be extensive without producing a useful record. In that situation, a free chart, a spreadsheet or a narrower competing product can be sufficient. The useful comparison is actual work completed against total annual cost, not the number of dashboards.
⚖️ TradingView Alternatives and Comparisons
| Platform | Primary decision dimension | What to check |
| TradingView | Charting & Technical Analysis | Vendor plan features, data coverage and total cost |
| TrendSpider | Different approach to the same task | Workflow and data comparability |
| Finviz | Specialised research or journal tools | Integration and output needs |
| FX Replay | Complementary tool or workflow | Whether it replaces or supplements the stack |
Compare TradingView against TrendSpider with the same instrument, historical window and output requirement. A second candidate such as Finviz may solve only one part of the process. If the job is verify conditional alerts against the selected subscription’s quotas, record which product completes it with fewer undocumented assumptions. Comparing a journal to a screener simply because both concern markets does not establish that one is superior.
🔎 TradingView in Practice: Detailed Research Notes
A realistic research session
A useful TradingView trial starts with an FX or equity watchlist rather than a wall of indicators. Build a layout with a higher-timeframe chart, an execution-timeframe chart and one saved alert, then close the browser and reopen it. Verify that drawings, watchlists and alert conditions remain attached to the correct symbol and exchange feed. On stocks, make sure the ticker belongs to the intended venue; on Forex, identify the quote source. A candle that appears identical in shape can still close at a different time when provider sessions are not synchronized. If your workflow needs intraday replay, test whether that interval is available for the specific instrument, not just on a demonstration chart.
Which features change the work?
The central attraction is the combination of charting, Pine Script studies and a marketplace of community ideas. That breadth is also a trap: two scripts called by the same name may calculate signals differently, especially if one uses future bars or intrabar updates. Read the script description, understand its confirmation logic and compare signals on closed candles before building alerts around it. A visual strategy tester can support hypothesis screening, but its report should be treated as a simulation. You still need to model order costs, spreads, gaps, position sizing and market availability independently. For serious research, exporting a series and keeping a reproducible version of your script is more useful than collecting screenshots of an attractive equity curve.
Market data, definitions and timing
TradingView aggregates symbols from multiple venues, which means the exchange shown next to the instrument matters. The platform subscription and any exchange-specific real-time data licence are different purchases. Someone analysing an ETF can accidentally mix an exchange’s delayed feed with a broker’s current quotes. A futures user should establish whether the desired contract is continuous or a specific expiry, since rolls can alter historical comparisons. For multi-timeframe work, record the session and chart timezone; otherwise a weekly or daily candle may not align with a broker report. None of these issues is fixed merely by moving from Essential to a higher subscription tier.
The subscription decision
The annual examples published by TradingView put Essential at $12.95 per month, Plus at $29.95, Premium at $59.95 and Ultimate at $199.95, when billed annually. Those are not cancellation-any-month prices. The value differences include chart and indicator limits, histories and numbers of alerts, and some users may still need separately charged market data. Decide which restriction actually interrupts the task before paying for more charts or indicators. A researcher who needs two layouts and a handful of alerts can arrive at a different answer from someone monitoring hundreds of signals. Confirm professional-user eligibility and the full checkout charge, including tax and data entitlements.
How it compares with alternatives
Against TrendSpider, TradingView is often the more natural starting point for someone who wants to write or adapt Pine scripts and build manual chart layouts. TrendSpider emphasizes automated chart analysis and scanning across conditions. Against Finviz, TradingView is more oriented toward chart-driven workflows; Finviz is designed for screening and research across US stocks and ETFs. FX Replay is a different type of product because its central promise is deliberate historical practice and logging. None of these is a simple better/worse decision. Run one task, note the time taken and check whether export and data history satisfy your requirements before paying for a yearly plan.
Where an attractive dashboard can mislead
A common evaluation failure is to judge alert accuracy from the chart after the candle has closed. That does not tell you whether an alert would have arrived in time for a trade, nor how the broker quote differed. Another failure is forgetting that a published indicator can change when its author updates the script. Record the script version and alert settings; if you share results, specify whether alerts were configured on bar close and which symbols were covered. Finally, do not equate a replayed fill with a real execution. Price movement through a level is not proof of available liquidity at that price.
🔍 Related TradingView Questions Worth Checking
A TradingView free vs Essential decision starts with the number of chart layouts and alerts you actually maintain. Someone watching one daily stock chart may not need the same access as a multi-market researcher. The TradingView Plus vs Premium choice matters only after chart, history and alert limits have been tested against a real working day.
For TradingView alerts limits, check whether your chosen plan supports the number of alerts and the bar-close conditions your process requires. A useful TradingView Bar Replay review should test a specific symbol and interval rather than assume that the replay depth is identical across markets. TradingView charts are best compared using matching quote sources and session settings.
With TradingView Pine Script backtesting, distinguish a reproducible script from an impressive-looking strategy report. A second test using TradingView forex charts should check broker feeds, candle-close times and intraday spreads. Readers comparing TradingView vs TrendSpider need to decide whether custom scripts or automated screening better matches the task.
A TradingView stock screener review should show the filters used and whether the results can be exported or revisited. TradingView real-time data fees are a separate question: paying for a platform tier does not necessarily secure the exchange entitlement needed for that security. Always note the symbol, venue and data delay before comparing results.
For TradingView crypto charting, inspect the exchange behind each symbol, especially when the same token trades on several venues. The TradingView annual plan cost depends on the billing period, data entitlements and regional taxes. A TradingView subscription is worthwhile when its particular charting and alert limits save repeatable work, not because the highest tier has the longest feature list.
🔬 TradingView — Practical Product Analysis
Pine Script and the reliability of a plotted signal
A Pine strategy can produce an attractive equity curve without modeling the execution a trader could obtain. Its properties matter: order sizing, commissions, slippage, pyramiding, calculation on candle closes, and handling of intrabar moves. A historical OHLC candle is not a record of every transaction inside it. If the strategy depends on an exact stop or limit fill, compare the tester's modeled event with the available lower-timeframe history and specify the assumptions. Save the Pine version with each reported result; code and settings can change without the chart revealing it. This is software research, not an independently demonstrated trading edge.
The public indicator library creates flexibility and a separate verification burden. Some scripts plot a final signal only after future bars arrive, and a higher-timeframe request can behave differently on a still-open candle. A useful check is to run a closed-bar alert alongside the indicator, then examine unfamiliar historical sessions instead of selecting appealing examples. Community scripts do not receive universal validation from the platform. When reviewing an apparent signal failure, identify whether the issue belongs to Pine logic, a third-party indicator, or the underlying chart data before drawing conclusions about the product.
Exchange feeds, chart limits and total cost
TradingView's Essential subscription currently lists two charts per tab, five indicators per chart and twenty price alerts plus twenty technical alerts. Plus lists four charts, ten indicators, and one hundred alerts of each kind. These are practical differences: someone following a handful of currency pairs on two timeframes may have ample space under Essential, while a multi-symbol alert system can run into limits quickly. Other features and promotional prices depend on the plan matrix and annual billing. Treat data entitlements as a separate question rather than assuming that paying for a more expensive interface activates every professional exchange feed.
A ticker is not always a single comparable data source. The exchange prefix on an equity chart, a continuous versus dated futures contract, and the selected crypto venue can each affect historical reference levels. Futures rolling conventions deserve particular attention: a continuous series may not show the exact prices available for execution in a specific expiring contract. Save the source symbol, session setting, timezone and bar type alongside annotated trades. A discrepancy with a broker platform does not automatically mean that one feed is broken. It may reflect legitimately different market sources or candle conventions.
Who benefits from this interface?
A practical trial for a discretionary Forex analyst would begin with one monthly-to-hourly context layout, a separate entry timeframe, and two alerts configured for completed bars. Reopen the chart in another browser session and confirm that drawings and watches retain the correct symbols. Then test the same historical event in Bar Replay, noting any unavailable interval. A clean result demonstrates ease of organization, not profitability. If the obstacle is the number of simultaneous alerts, an upgraded tier might help; if it is a difference between broker prices and the chart feed, a more expensive chart tier is not necessarily the answer.
TrendSpider emphasizes rule-driven scans and automated technical annotation; Finviz is strongest as a US stock discovery workspace; FX Replay focuses on deliberate simulation sessions. TradingView is more compelling for someone who wants custom chart studies, manual drawing tools and a shared set of symbols across devices. Choose between these workflows using one defined task, not the number of decorative panels. Recording the output and subscription needed gives a reader more information than claiming a universal winner for all traders.
Further decision considerations
A charting plan needs to be considered as a set of operational limits, not a ladder of prestige. In particular, number of saved layouts, chart connections and price/technical alert quotas have different implications for a trader monitoring one instrument and someone maintaining automated watchlists. Consider whether alerts must persist through weekends and whether they should be configured on a closed bar. An alert based on an unfinished candle may fire during a move that later disappears from the completed chart. Such behavior is not necessarily a platform defect; it is a consequence of the condition the user selected. A serious demonstration should distinguish a repainting signal from legitimate intrabar changes and show the exact rule that triggered the notification.
🧪 How DigiOffly Evaluates This Software
- Build a multi-timeframe watchlist and save a repeatable chart layout
- Test alert limits and multi-condition alerts in the chosen plan
- Replay a defined historical session and compare signal timestamps
- Check symbol exchange and real-time versus delayed entitlement
For TradingView, our proposed test log includes the plan used, the date, the evidence for replay a defined historical session and compare signal timestamps, and any constraint from backtested fills do not automatically model actual brokerage execution. These are proposed checks; our current documentation does not establish the results of an independent benchmark. A legitimate revision should link the screenshot, the source record and a clear description of what was and was not verified.
🏆 Final Verdict: TradingView Software Review
TradingView deserves consideration when its specific features address a documented research or workflow requirement. The main decision remains practical: can you reproduce the result with the data and access included in the plan, and is the recurring cost lower than the time and errors the software can reasonably prevent? TradingView stands out for visual workflow, time-frame analysis and alerting, but a subscription is not a market-data licence for every exchange. A futures specialist should verify the specific feed, whereas a forex discretionary trader may prioritise chart layout, replay depth and alerts. Pine strategies are research tools, not independent performance evidence.

Frequently Asked Questions
What does TradingView do?
TradingView is designed around charting & technical analysis. Its primary use depends on the features and data you activate.
Is TradingView free?
TradingView has a free entry option or limited free access. Check which functions are included before relying on it for an ongoing workflow; paid features and data may require a subscription.
How much does TradingView cost in 2026?
The vendor advertises annual-billing equivalents starting with Essential at $12.95 a month; higher tiers and exchange data raise the total. Check the pricing source linked above for the current region, billing cycle and conditions.
Is TradingView suitable for beginners?
A beginner can start with one narrow workflow, but should verify terminology, plan restrictions and whether a free alternative meets the need.
Does TradingView guarantee profitable trading?
No. Research, charting, journals and backtests cannot guarantee financial outcomes; hypothetical results have important limitations.
What market data does TradingView include?
Coverage and history are product- and tier-specific. Check the exact instrument, venue, time interval, licence and data-refresh terms.
Can I use TradingView for crypto, forex or stocks?
Check the official supported markets and feature matrix. Product support may differ from the availability of paid real-time exchange feeds.
Can I export my research from TradingView?
Review the export, API, CSV and reporting entitlements of the chosen plan. Data licences may limit redistribution.
What are the biggest limitations of TradingView?
Data entitlements and professional exchange fees can be separate; Historical replay depth, chart counts and alerts depend on plan; Backtested fills do not automatically model actual brokerage execution.
What are alternatives to TradingView?
Start with TrendSpider, Finviz, FX Replay and compare a consistent task, current pricing and market coverage.
What should I verify before paying for TradingView?
Confirm data entitlements, annual versus monthly billing, taxes, usage caps, cancellation and the outputs you actually need.
EXPLORE NEXT ON DIGIOFFLY
🔍 Explore More on DigiOffly
After reading this TradingView review, explore related software and verify the practical differences before buying.
Explore related categories
Compare your shortlist
Build your software stack
- Cost Calculator
- Software Stacks
- Research Standards
- TrendSpider review — Compare scripted charts with automated scanning
- FX Replay review — Use a dedicated historical practice workflow