

Pricing and specifications checked 2026-11-20 against vendor primary sources. Conditions, billing cycles and regions may change.
Dune is an onchain analytics platform for people who want more than a price chart. Instead of asking whether a token is up today, an analyst can investigate what blockchain transactions actually show: where swaps occur, how a protocol's activity changes, how many distinct addresses interact with contracts, and what those observations do not prove. Dune combines public dashboards, queryable blockchain datasets, a SQL editor, charts, scheduled reports and a Data API. Its real advantage is flexibility, but flexibility has a cost: somebody must understand the data model and guard against false conclusions. This Dune Analytics review examines the product as software, not as a recommendation to trade a particular asset.
DigiOffly currently uses direct non-affiliate product links. Vendor claims are distinguished from independently observed tests. No investment or trading advice is provided.
📊 Dune Review Summary
Dune Analytics is most useful when someone needs to define a metric instead of accepting an aggregator's existing definition. A protocol researcher may compare transaction activity across chains, a product team may measure repeat wallet participation, and a data engineer may deliver results into an application. Public dashboards make Dune approachable, but the current Free offering is view-only. Creating and executing new queries, scheduling work and using credits at scale require an eligible paid plan. The review therefore separates browsing value from hands-on analytical capability, and contrasts Dune with Glassnode, CoinGlass, Nansen and DeFiLlama without pretending that these different products are substitutes in every scenario.
⚡ Quick Verdict: Is Dune Worth It?
For a reader comparing analytics software, Dune deserves a shortlist when custom SQL, reproducible methods and shareable onchain dashboards matter more than ready-made trade indicators. Dune dashboards can be an efficient way to inspect someone else's research before committing to a subscription, provided the viewer checks the author, query code, update time and chain coverage. For teams, the central buying question is how much query execution and API delivery they actually need. As checked in November 2026, the official Dune pricing page advertises a $0 view-only tier, an Analyst tier displayed at $65 per month with 4,000 credits, a Plus tier at $349 per month with 25,000 credits, and custom enterprise terms. These are reference prices, not a guarantee about taxes, renewals or annual checkout.
🏆 VERIFIED PRODUCT OVERVIEW — Dune
Custom onchain SQL, public dashboards and the real cost of query credits
Best for: Crypto researchers, blockchain product analysts and data teams that need reproducible SQL metrics
🧠 What Is Dune?
On a conventional finance website, a chart normally presents a metric defined by the publisher. With Dune Analytics, the analyst often begins a step earlier: selecting a blockchain dataset and writing the question. The platform indexes onchain information, exposes raw and decoded contract tables, and offers curated datasets for common activities such as decentralized exchange trading or token transfers. Users can write SQL queries, visualize results and arrange those visualizations into a dashboard. This makes Dune closer to a data workbench than to a broker terminal.
There are two very different ways to interact with the service. A casual visitor can discover, inspect and copy public queries and dashboards. That is enough for a preliminary review of the Dune analytics dashboard ecosystem. Building a new analytical pipeline requires additional access, knowledge of table semantics and a budget for computation. The difference is important because older tutorials still refer to free SQL execution; the current public pricing page explicitly positions Free as view-only.
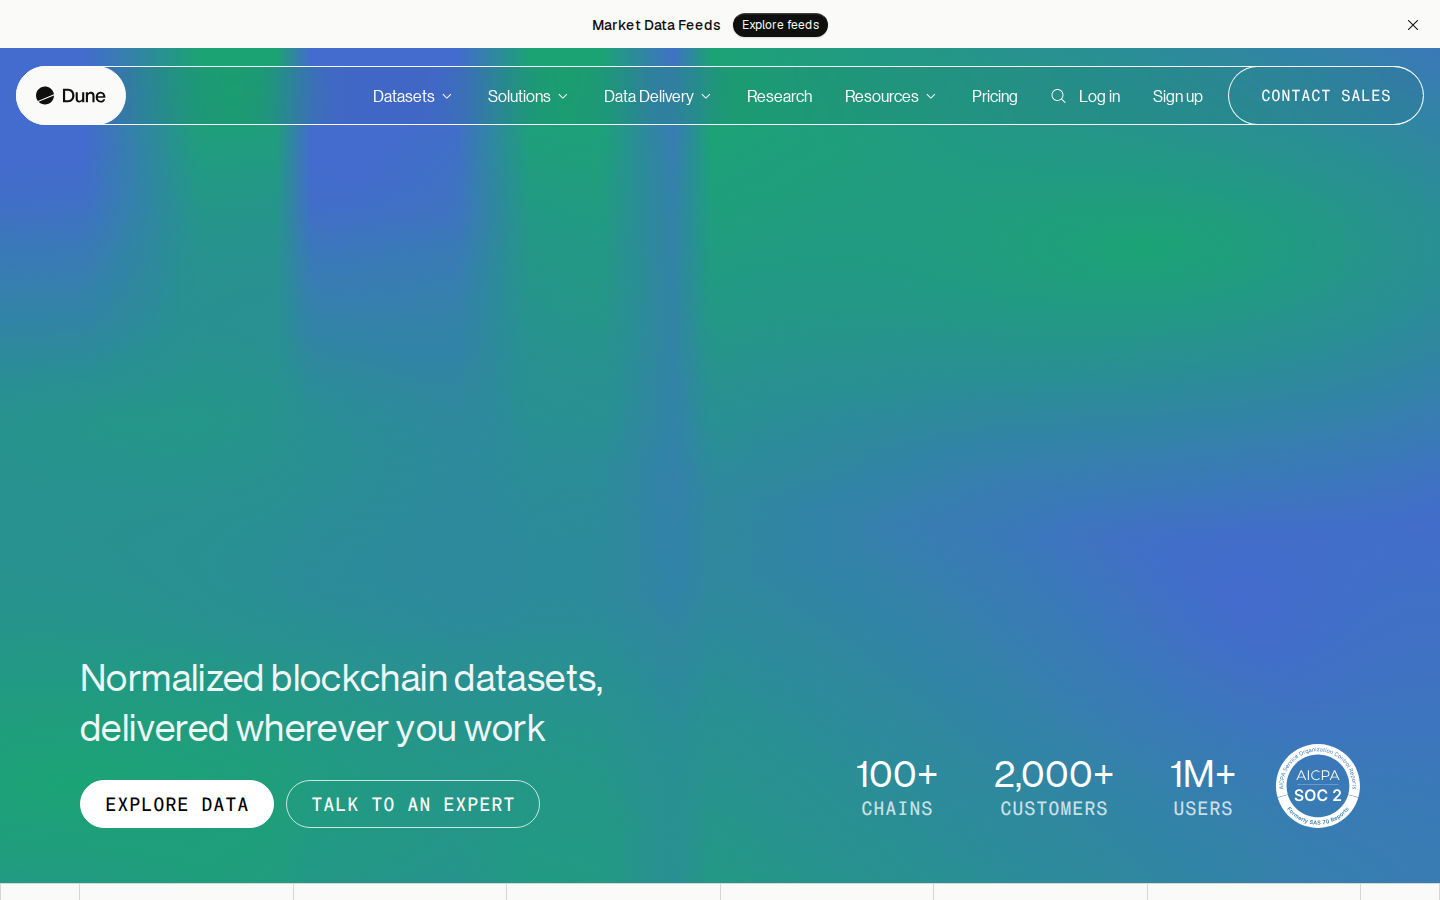
🖥️ Ease of Use & The User Interface
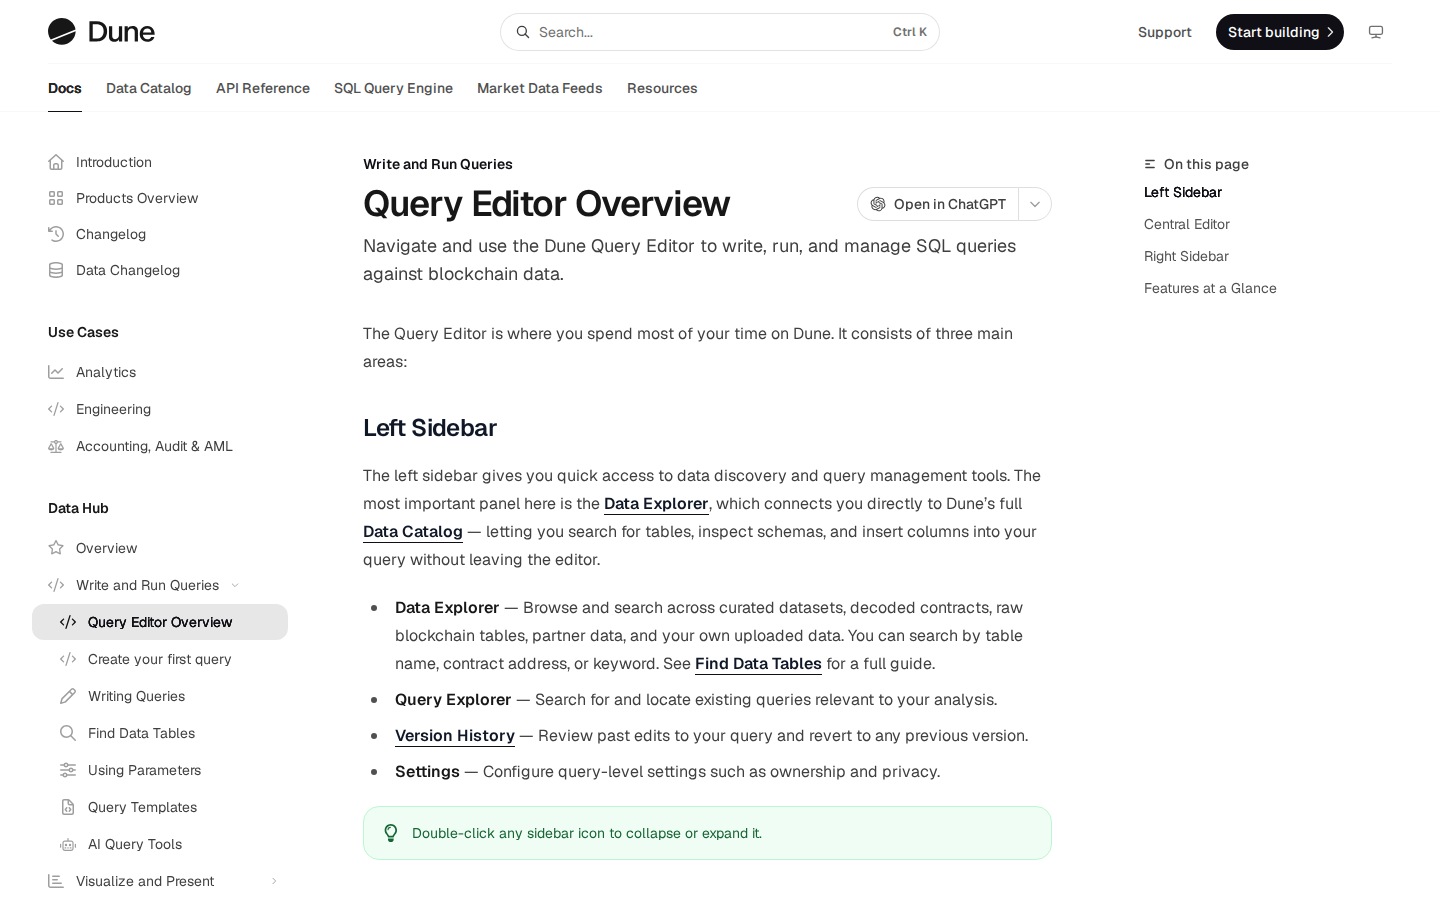
A public Dune dashboard can look approachable: a title, a date selector, colorful charts and a short explanation. Creating the underlying results demands more care. The Query Editor uses SQL, while Data Explorer helps locate the right tables and inspect their fields. A beginner can learn by opening a public query and reading how the author joined datasets, but a copied query is not automatically correct for a new chain or date range. Before paying, try to read a complete example and identify the output fields without relying solely on the chart.
Dune documentation also describes query parameters, chart widgets, dashboard layouts, scheduled refreshes and API endpoints. These form a coherent workflow when a team has clear questions and SQL skills. They can feel excessive to somebody who merely wants a weekly portfolio balance or a conventional market chart. The interface is therefore best described as capable rather than effortlessly simple.
🧭 How to Use Dune for Beginners
This is a documented workflow for investigating a real question such as 'How has one protocol's weekly onchain activity changed?' It is not a claim that DigiOffly executed paid queries. Dune users can adapt the sequence after checking the available plan and confirming the official site. Separating the business question from the first chart is the most useful discipline for a beginner.
1. Define the question and the unit of measurement
Write down the entity and period before opening the Dune query editor. Are you counting wallet addresses, transaction hashes, swap events, dollar-denominated transfers or unique deposits? A dashboard titled 'users' could be counting addresses instead of people. Decide whether cross-chain interactions should be summed or deduplicated and how to treat contracts versus externally owned accounts. For trend analysis, choose a comparable time window and state whether activity is measured by event time, block date or data ingestion time.
2. Find the dataset and inspect a published Dune query
Start by exploring public Dune dashboards and the official Data Explorer. Find a query that is close to your intended task and inspect its SQL rather than judging it by a screenshot. Look for table names, joins, address filters, token decimal normalization and assumptions about contracts. Curated tables can shorten work, but their definitions and update schedules may differ from raw chain data. Document the schema and the snapshot date you actually used.
3. Draft a small SQL query and test the output
On a plan that supports query execution, begin with the narrowest practical date range and a small output. Group by an explicit period, apply the intended chain or contract filters, and verify the rows before adding expensive joins. SQL functions can aggregate events quickly, but a distinct address count is not the same as a distinct human count. Likewise, a DEX trade dataset can contain routed transactions whose aggregation requires care.
Review the table description and, where appropriate, compare a sample transaction with an independent block explorer.
4. Visualize results and write an honest dashboard note
Once the underlying table is coherent, use Dune's charting options to create a line series, bar chart, counter or table. Choose visualizations that reflect the data. A cumulative chart can hide falling daily activity, and a scale dominated by one outlier can make smaller changes nearly invisible. State the measurement window and explain whether numbers are estimates, decoded values or simple raw event counts.
The Dune dashboard builder allows text alongside charts. Use that space to link the underlying query, list chain coverage, identify important exclusions and describe when the result was last refreshed.
5. Plan refreshes and API access only when needed
If the research will be repeated, consider scheduling the query or using the Dune Data API to retrieve a saved result. Review the paid plan's credit allowance, per-call costs, concurrency rules and export limitations before automating. Polling every minute does not create genuinely fresh blockchain data when the underlying dataset updates more slowly. Caching results and requesting only necessary columns can be better design than continuously rerunning a costly query.
🛠️ Key Features That Actually Matter
The following capabilities are documented by Dune. Their relevance depends on whether the buyer wants public research, paid SQL analysis, a maintained reporting workflow or programmatic data delivery. We separate the supported feature from any claim about speed, coverage or accuracy that cannot be established without a controlled live test.
Dune SQL Query Editor and Data Explorer
The Query Editor is the analytical core of Dune. It lets a user work with SQL over blockchain datasets and preview tabular output. Data Explorer helps locate raw transaction tables, decoded event tables and curated datasets. That distinction is valuable when a question moves from a single known contract to a cross-protocol comparison.
For example, a token-transfer table may be useful when analyzing transfer counts, while DEX trade tables can describe swap activity more directly. Mixing the two without a clear definition may double-count the same economic event.
Official source: Dune documentation: Dune SQL Query Editor and Data Explorer.
Decoded and Curated Onchain Tables
Dune supplies indexed blockchain data and documentation for curated families of tables. Raw logs preserve onchain evidence, decoded contracts make event semantics easier to read, and curated datasets put common analytical patterns into reusable formats. Choosing the right level can reduce unnecessary engineering, but it also changes the questions you can answer.
A researcher should inspect how a table is built, which chains it covers, and whether material changes to its schema have been documented. New blockchain contracts, upgraded protocols and token migrations can create reporting breaks.
Official source: Dune documentation: Decoded and Curated Onchain Tables.
Custom Dune Dashboards and Visualizations
Dune dashboards combine visualizations and text widgets so that research can be read without opening a SQL editor. A finished dashboard might include a transaction activity chart, cumulative protocol fees, a cohort table and explanatory notes. The platform's documentation describes moving and resizing widgets, adding a visualization from a query, and sharing the resulting page.
That flexibility makes Dune dashboards useful for protocol updates and recurring community reports. A well-designed dashboard helps a stakeholder quickly see what changed and then inspect the underlying query. Its danger is the opposite: a visually convincing graph can spread a misleading metric at scale.
Official source: Dune documentation: Custom Dune Dashboards and Visualizations.
Query Scheduling, Alerts and Refresh Discipline
The Dune scheduler can automate selected query or dashboard refreshes, while alert features provide a way to watch for results that meet a defined rule. This can support operational reporting, such as monitoring unusual protocol volumes or tracking a known contract's activity over time. The platform's documentation cautions that dashboards may show older results if queries have not recently been executed.
Scheduling is a workflow feature, not a trading edge. If an analyst needs a genuinely low-latency alert, they must inspect source data ingestion, query runtime, plan limits and notification delays.
Official source: Dune documentation: Query Scheduling, Alerts and Refresh Discipline.
Dune Data API and Reusable Query Results
The Dune Data API gives developers a route to run saved queries, retrieve results, inspect execution status and incorporate onchain analysis into other systems. This is a different purchase decision from viewing public dashboards. API automation involves keys, request limits, credits and technical maintenance, and it can require a clear plan for error handling.
For example, a research application may request last week's DEX data once per day and render it in its own interface. An engineering team could create a small cache so the same Dune query is not charged repeatedly for every page visitor.
Official source: Dune documentation: Dune Data API and Reusable Query Results.
Dune AI Assistance for Writing and Debugging SQL
Dune documents AI query tools that can generate, modify and debug SQL using natural-language instructions. For someone who understands the data but not every SQL detail, assistance may reduce the friction of beginning a query. Dune AI can also support iteration when the first version produces an error or needs a join.
The limitation is analytical correctness. A generated query may run successfully while selecting a table with different semantics from the one requested. It may group addresses incorrectly, overlook contract upgrades or assume that one chain's schema matches another's.
Official source: Dune documentation: Dune AI Assistance for Writing and Debugging SQL.
✅ Pros & Cons of Dune
Pros
- Flexible SQL analysis over extensive onchain datasets, rather than only predefined metrics.
- Public Dune dashboards and copied queries can be explored without paying for a full workspace.
- Official documentation covers dataset discovery, charts, schedules and a programmable Data API.
- Sharing source queries can make a research finding more transparent and reproducible.
- Curated data and decoded tables reduce some of the repetitive indexing work.
Cons
- View-only Free tier is not a free SQL execution workspace under current public pricing.
- SQL and blockchain data-model knowledge are needed to judge complex outputs.
- Compute, exports and API usage can consume credits and exceed a simple seat-price assumption.
- Data freshness and wallet identity interpretation require independent verification.
- Published dashboards may be copied or reused without their original limitations.
👾 Limitations & Reality Check
A Dune chart is evidence of a query result, not proof of a causal story. Wallet addresses are not verified people. A large swap may be arbitrage, a router hop, a wash-like transfer or a genuine user trade; the query definition decides what appears. Blockchain data can also change in analytical systems because of indexing delays, chain reorganizations, decoding updates or source corrections. The fact that a graph refreshes today does not mean every underlying table is real-time.
There are product boundaries. Dune is not a broker, an exchange, a wallet approval revoker, a full AML investigation suite or a guaranteed token-price predictor. Users who need to revoke permissions should consider a dedicated security utility, not a custom analytics query. Teams that require stable identity labels, regulatory case workflows or legal evidence management should examine specialist tools and relevant compliance obligations. Dune documentation describes its software features; it cannot guarantee that an independently authored metric satisfies a regulatory standard.
💰 Pricing Plans & Real Costs
The official Dune pricing page, checked for this review, displays Free at $0 per month with view-and-copy access to public dashboards and queries. It should not be confused with an account that can execute unlimited SQL. The advertised Analyst option is $65 per month and includes three seats and 4,000 monthly credits; Plus is displayed at $349 per month with ten seats and 25,000 credits plus expanded private collaboration and export capabilities. Enterprise has custom commercial terms, governance, and possible data sharing or licensing options.
Dune also advertises a seven-day trial of paid features. The vendor warns that adding a card can place a temporary hold for the plan amount, subsequently released when the trial is canceled. Readers should check the on-screen subscription conditions before activating the trial; this review is not an enrollment confirmation. The pricing page mentions a saving with annual billing, but we have not verified a specific final annual checkout total, so we do not invent one here.
Costs should be modeled as seat commitment plus consumption.
| Plan | Cost / billing model | Region / billing period | Vendor source checked |
| Free | $0/month; view-only, no query execution | US reference; monthly display | https://dune.com/pricing (2026-11-20) |
| Analyst | $65/month listed; 4,000 credits/month, 3 seats | US reference; vendor monthly display | https://dune.com/pricing (2026-11-20) |
| Plus | $349/month listed; 25,000 credits/month, 10 seats | US reference; vendor monthly display | https://dune.com/pricing (2026-11-20) |
| Enterprise | Custom quote; enterprise licensing / support | US / negotiated; contact sales | https://dune.com/pricing (2026-11-20) |
🎯 Who Should Use Dune?
Dune suits researchers who want to answer their own questions about blockchain activity and are prepared to explain the method. A protocol growth lead may use Dune Analytics to follow cohort retention, but should define whether a 'new user' means the first address interaction or the first economically meaningful transaction. A decentralized exchange analyst may compare liquidity and volume across contracts, but must understand routed swaps and changing token valuations. A data engineer may prefer Dune when an existing warehouse needs reproducible query results delivered over an API.
There are weaker fits. Somebody looking for ready-made perpetual futures heatmaps may prefer CoinGlass. A portfolio investor reading network cycles may find Glassnode's prebuilt metrics more convenient. A wallet-security beginner concerned about approvals may be better served by Revoke.cash or an official block explorer. An analyst wanting named institutional wallets or investigative entity graphs should evaluate Nansen or specialist compliance products.
⚖️ Dune Alternatives
A fair Dune Analytics review compares alternatives by the job they perform, not by a single generic star rating. Dune is a configurable SQL research workbench. Some alternatives prioritize curated network indicators, derivatives market observations, wallet intelligence or ready-made DeFi totals. The right software mix may include two non-overlapping tools rather than one direct replacement. We compare documented positioning, not fabricated head-to-head execution benchmarks.
Glassnode vs Dune
Glassnode concentrates on curated onchain and network metrics intended to help readers interpret market activity. Its interface can suit someone who wants established indicators without creating a separate SQL workflow. Dune can be a better fit when the analyst needs a custom contract-specific calculation, a new cohort definition or a reproducible dashboard grounded in raw tables. The trade-off is time spent validating queries and credit use.
CoinGlass vs Dune
CoinGlass emphasizes derivatives and market positioning indicators, such as futures activity, funding and liquidations. Dune instead begins with onchain datasets and user-defined analytical questions. A crypto derivatives trader checking current sentiment may get to the answer faster in CoinGlass, while a researcher investigating an onchain protocol's unique contract events may need Dune.
Nansen vs Dune
Nansen is positioned around wallet and entity analysis, with commercial labeling and interpretation layers. Dune users can study public addresses and construct their own classifications, but that is not equivalent to buying a maintained proprietary wallet attribution product. A compliance or investigative task may require chain-of-custody procedures and higher-quality entity evidence than a public dashboard provides.
DeFiLlama vs Dune
DeFiLlama offers broad public DeFi metrics in a much more packaged format. Someone answering 'What is this protocol's reported TVL?' can often begin with a published DeFiLlama table, subject to its methodology. Dune Analytics becomes more relevant when the metric needs a special contract filter, cohort analysis, a fresh visualization or an integration into a custom reporting workflow.
Comparison: Dune vs Alternatives
This comparison focuses on methodological control, time to first useful answer and appropriate scope. The terms 'better' and 'cheaper' depend on the question. A free public dashboard can answer a one-off question without running a query; a bespoke production report can require a paid Dune subscription and ongoing maintenance. The comparison table summarizes documented product orientation, not universal winners.
| Consideration | Dune | Alternatives |
| Primary job | Custom onchain SQL, dashboards and data delivery | Glassnode: curated metrics; CoinGlass: derivatives; Nansen: entity intelligence |
| Learning curve | SQL plus blockchain data semantics for original analysis | Many predefined dashboards require less self-authored query work |
| Free access | Public dashboard browsing/view-only Free plan | Free viewing and data limits vary by alternative and feature |
| Source transparency | Public Dune queries can expose SQL and data lineage | Proprietary indicators may publish methods with less query-level visibility |
| API and automation | Data API, scheduled queries, credit-based usage | Provider-specific APIs, licenses and delivery methods differ |
| Not a replacement for | Broker execution, wallet revocations or full AML case management | Some alternatives target separate specialist jobs |
How to Audit the Accuracy of a Public Dune Dashboard
Dune crypto analytics dashboards work best when the first question concerns the metric, not the presentation. Before sharing a chart from the Dune dashboards library, inspect the underlying query and note its last successful execution. Read the table definitions, any hard-coded contract addresses and the handling of token values. Determine whether the chart displays raw transactions, decoded events, token transfers or something more carefully modeled. A title like 'active users' is ambiguous without a definition of address uniqueness and a time window.
One useful audit is to reproduce a small daily total from a handful of transactions on an independent block explorer.
Dune Analytics Prediction Markets and Polymarket Use Cases
Public Polymarket dashboards built on Dune can help researchers describe transaction patterns associated with prediction-market contracts. A useful question may concern contract usage, deposits, market participation or cumulative public transaction counts. Dune Analytics prediction markets research describes public events; it does not forecast which outcome will occur. The quality of an answer depends on contract coverage, how trades and positions are interpreted, and whether offchain activity is excluded.
Dune Analytics NFT Reports: What the Volume Actually Measures
Dune Analytics DeFi research depends on a clear definition of volume, users and coverage across chains. Queries about NFT trading and decentralized exchanges illustrate why onchain research demands definitions. An NFT report built in Dune may count unique contracts, mint transactions, transfers, marketplace sales or aggregate proceeds. These are not interchangeable. A single asset can be minted, transferred and sold repeatedly, while marketplace data may require special handling of royalties, wash-like behavior and collection migrations.
Dune Analytics DEX Reports: Why Routed Swaps Can Be Double-Counted
In DEX studies, routed swaps and aggregators create another risk of double-counting. If one user trade touches several pools, naïvely summing underlying events can overstate distinct user decisions.
A reliable DEX report explains whether it counts swaps, transaction hashes, pool events or unique traders. It should also document chain coverage before an analyst compares volumes across networks.
Dune Analytics Pricing Scenarios for a US Research Team
Consider three use cases rather than a generic 'best plan'. A reader who only follows published dashboards can use the documented view-only Free tier and may never need an API key. A small research team preparing a few weekly reports should examine Analyst's included credits and three seats, then estimate how often SQL queries will run. A larger group that needs private dashboards, expanded exports and ten seats can examine Plus, but an increased credit allowance does not remove the cost of maintaining accurate queries.
🧪 How We Evaluated Dune
DigiOffly prepared this review from the official Dune website, current public pricing page and Dune documentation for the query editor, Data Explorer, dashboards, schedules, AI and API. The screenshots are original captures of public official web pages, not staged images from a subscription account. We did not enroll in the seven-day trial, run paid SQL queries, benchmark engines or collect proprietary vendor data. We compare documented capabilities and the implications for common research tasks. Claims about speed, data accuracy, coverage or cost are qualified where no independent measurement exists. The author is Alex Wright. Any external link opens the relevant product or documentation page; this is an editorial software review and not investment advice.
Method: documentation-based analysis of published vendor sources; no independent product access or benchmark is claimed.
🏆 Final Verdict: Dune Review
Dune is a compelling onchain analytics platform for teams that know what they want to measure and are willing to own the SQL behind the answer. The public library is useful for discovery, while paid plans supply the query execution, refresh and collaboration capabilities needed for original workflows. The practical constraint is not simply the subscription price. It is the time required to verify source tables, explain indicators, monitor credits and update dashboards as protocols change. For those willing to do that work, Dune can serve as a durable analysis environment. For casual chart viewing or quick trading indicators, a more specialized tool may be easier. No software review, including this one, can promise that a blockchain metric will produce profitable trades.

Frequently Asked Questions
What is Dune Analytics used for?
Dune is software for exploring blockchain data through public dashboards, SQL queries and programmatic exports. It can support protocol reports, wallet activity research and custom onchain metrics. It is not a cryptocurrency trading exchange, custody wallet or guaranteed forecasting service.
Is Dune Analytics free in 2026?
The current official Free tier provides view-only access to public Dune dashboards and queries. It is not a free SQL-execution workspace under the published plan description.
How much does Dune Analytics cost?
The official November 2026 reference page lists Analyst at $65 monthly and Plus at $349 monthly, with Enterprise quoted by sales. Analyst shows 4,000 credits and three seats; Plus shows 25,000 credits and ten seats.
What is the difference between Dune and Glassnode?
Dune emphasizes flexible self-authored SQL over onchain datasets; Glassnode focuses on packaged network and market metrics. Analysts needing a custom contract-specific calculation may prefer Dune, while readers seeking prebuilt measures may prefer Glassnode. Neither product guarantees investing outcomes.
Can Dune dashboards be inaccurate or outdated?
Yes. Dashboards depend on query logic, table coverage and execution timing. Dune documents scheduling features, but a public chart can show stale results or a metric that does not measure what its title suggests.
How do I start with a Dune Analytics tutorial?
Open a public dashboard, read the underlying SQL and locate its source tables in Data Explorer. Define a small question and inspect units before attempting a paid query run. The official Dune analytics docs explain the query editor, dashboard widgets and execution limits.
Does the Dune Analytics API offer free access?
The Data API supports query execution and result retrieval, but current pricing ties API usage to eligible plans and credit limits. Do not assume unlimited free access based on older tutorials. Budget for query executions, result volume, caching and license terms.
Can Dune Analytics Polymarket dashboards show actual trading activity?
Dune Analytics Polymarket dashboards can examine onchain activity where appropriate public tables are available. The findings depend on the covered contracts and event definitions. They cannot guarantee prediction-market outcomes or account for all offchain behavior.
Can Dune Analytics analyze NFTs or DEX activity?
Yes. Curated and decoded tables can support Dune Analytics NFT and DEX research. Define whether you count trades, transactions, transfers or unique addresses, and verify routed or multi-leg events to avoid overstating volume.
Is Dune Analytics suitable for someone who does not know SQL?
Browsing public dashboards is straightforward, but authoring reliable analyses takes SQL and blockchain data understanding. Dune AI assistance can help draft queries, yet users must check table selection, joins and definitions. A ready-made analytics provider may be better for nontechnical one-off needs.
What are the best Dune Analytics alternatives?
Relevant alternatives depend on the job: Glassnode for curated onchain indicators, CoinGlass for derivatives market data, Nansen for labeled wallet intelligence and DeFiLlama for public DeFi overviews.
EXPLORE NEXT ON DIGIOFFLY
🔍 Explore More on DigiOffly
Crypto Market Analytics software hub
Review the full trading and onchain analytics software collection.
Browse Crypto Market AnalyticsCoinGlass review
Compare derivatives indicators with query-based onchain research.
Read CoinGlass reviewDefiLlama review
Compare documented DeFi protocol metrics with custom SQL research.
Read DefiLlama reviewNansen review
Study labeled Smart Money wallets and wallet profiling alongside SQL dashboards.
Read Nansen reviewGlassnode review
Consider curated network metrics alongside custom SQL dashboards.
Read Glassnode reviewKoinly review
Keep tax transaction records separate from analytical trading charts.
Read Koinly reviewRevoke.cash review
Review wallet contract permissions with a dedicated security tool.
Read Revoke.cash reviewRabby Wallet Review
Explore wallet transaction previews alongside independent onchain research.
Read Rabby Wallet reviewPrimary sources and verification dates
- Pricing — Dune official documentation — verified 2026-11-20
- Products — Dune official documentation — verified 2026-11-20
- Query Editor — Dune official documentation — verified 2026-11-20
- Data Explorer — Dune official documentation — verified 2026-11-20
- Dashboard — Dune official documentation — verified 2026-11-20
- Scheduler — Dune official documentation — verified 2026-11-20
- Api — Dune official documentation — verified 2026-11-20
- Dune Ai — Dune official documentation — verified 2026-11-20
- Terms — Dune official documentation — verified 2026-11-20